UNH vs ELV stock in 2026 evaluation based on valuation scenarios, earnings growth, dividend strength and regulatory risk. Find out which of the two healthcare giants has more powerful expected returns and portfolio resilience up to 2030.
UNH vs ELV Stock Comparison 2026: What This Analysis Covers
When it comes to the stock comparison, UNH vs ELV in 2026, it will be a pure “quality vs quality” case, only that valuation discipline will be the key. UnitedHealth Group (UNH) and Elevance Health (ELV) are not speculative plays in healthcare. They are massive, systemwide and scaled insurers who work within commercial coverage, Medicare Advantage and government programs. They both enjoy a demography-driven and necessity of managing chronic illnesses that drive growth in healthcare demand over the long-term. Nevertheless, good companies do not necessarily translate into good investments.
The proper capital allocation and good business practices translating into economic profitability is the key distinction in 2026 that is usually priced in by the market into the current prices of each stock.
UNH has higher operating margin levels compared to ELV in the periods given, although the two firms have experienced recent pressure in net margins. That operating strength gives UNH structural support, but it still does not remove sector risk. CSM Medicare Advantage rate plans and policy changes are still impacting the earnings projections throughout the managed care sector (CMS, 2026). Similar to the responses observed in the previous market, seemingly small changes to reimbursement can have a significant impact on insurer valuations. Discover UNH’s 5-year stock forecast across various growth scenarios to guide your investment strategy.
The actual question in 2026 is which company is inherently more powerful in an absolute sense, as both companies are market leaders. The issue is which stock has a superior risk-adjusted balance between realistic growth assumptions, earnings durability and regulatory exposure.
UNH Is Already Cheap. ELV Needs a Miracle.
Table 1: Results Summary
| Metric | UnitedHealth (UNH) | Elevance (ELV) | What it suggests (2026 decision) |
| Valuation sensitivity (intrinsic value vs growth) | Intrinsic value rises from ~$272 at 2% to ~$435 at 6% growth | Intrinsic price rises from ~$219 at 2% to ~$340 at 8% growth | ELV requires higher growth to catch the current price line; UNH appears closer to fair value under moderate growth |
| Revenue trend | Up from 287,597 → 400,278 ($m, 2021–2024) | Up from 156,595 → 199,125 ($m, 2022–2025) | Both grew, but UNH shows larger scale + steady growth in the period shown |
| Operating margin trend | 8.33 → 8.07 (2021–2024) | 5.40 → 4.00 (2022–2025) | UNH has stronger operating profitability; ELV shows more compression |
| Net margin trend | 6.01 → 3.60 (2021–2024) | 3.76 → 2.84 (2022–2025) | Both are pressured, but UNH’s drop is sharper in the final year |
| Residual earnings per share | Peaks around ~15.4 (2023) then drops to ~6.2 (2024) | Peaks around ~11.4 (2021) then declines to ~6.8 (2025) | Both show late-period weakening; timing and normalization matter |
Explore the data interactively — toggle growth scenarios across V/P, Price/Share & Intrinsic Value
| Growth (%) | UNH IV ($B) | UNH P/Share | UNH V/P % | ELV IV ($B) | ELV P/Share | ELV V/P % | Δ V/P |
|---|
Figure UNH intrinsic value sensitivity (Growth vs Value per Share) and ELV intrinsic price sensitivity (Growth vs Price per Share)
ELV vs UNH Stock: Business Model Strength and Competitive Positioning
The two companies are both in a managed care position, but their engines are different. UNH is built on an insurance platform and a sizeable services division. ELV is a well-established insurance company which has been diversifying into services (Carelon).
This is important since the market tends to give a premium on diversified, services-based healthcare platforms, it also penalises if the cost trends, reimbursement policies or membership changes decline.
UnitedHealth’s Diversified Healthcare Platform and Optum Expansion
UnitedHealth defines itself as two complementary businesses, UnitedHealthcare (benefits) and Optum (care delivery, analytics/tech, and pharmacy services). This plan is meant to earn value throughout the healthcare chain: coverage, care, and pharmacy as opposed to premium spread (UnitedHealth Group, n.d.).
In terms of investors, this has a benefit of stability: a stressed component (e.g. insurance margins) can be compensated by other components. Complexity and increased regulatory focus are the trade-off where a large and integrated platform is subject to numerous payment flows.
Elevance Health’s Insurance Model and Government Program Exposure
The reporting by Elevance emphasizes that the key segment of the company is Health Benefits and that the engine of growth is Carelon (CarelonRx and Carelon Services).
ELV still relies greatly on the execution of insurance, and there was stricter margin compression in the later years. This does not imply that the model is weak rather what the market requires to be convinced, that services strategy can counter insurance cost pressure in a steady manner.
ELEVANCE vs UNH Stock Comparison: Revenue Growth and Margin Trends (2024–2026)
Between 2024 and 2026 both UNH and ELV have strengthen revenue growth, although the nature of this improvement is statistically significant. UNH operating margins are higher and its operation scale is stronger, whereas ELV operation margins are falling more steadily, which means that cost pressure is even greater (CMS, 2026).
Revenue Growth Trajectory and Membership Expansion
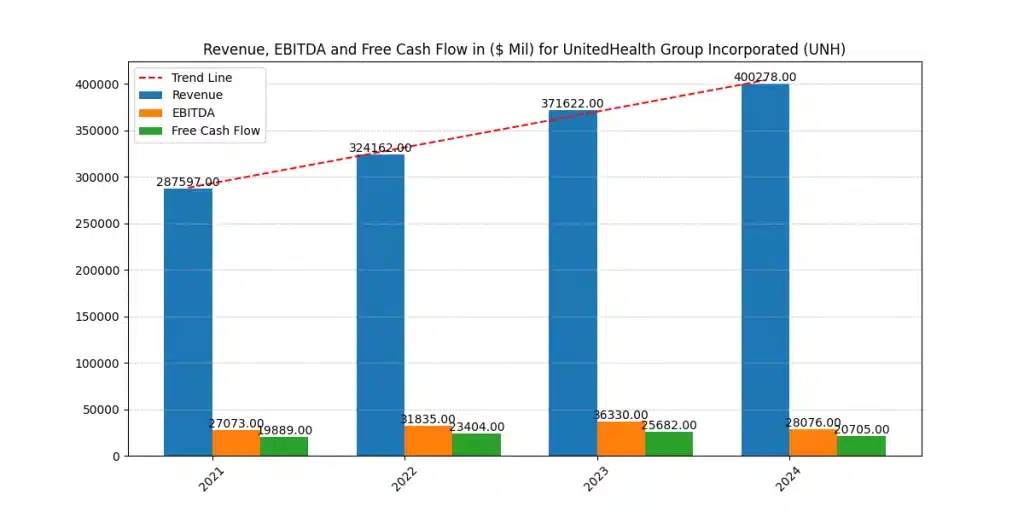
Figure 3. UNH revenue, EBITDA, and free cash flow trend
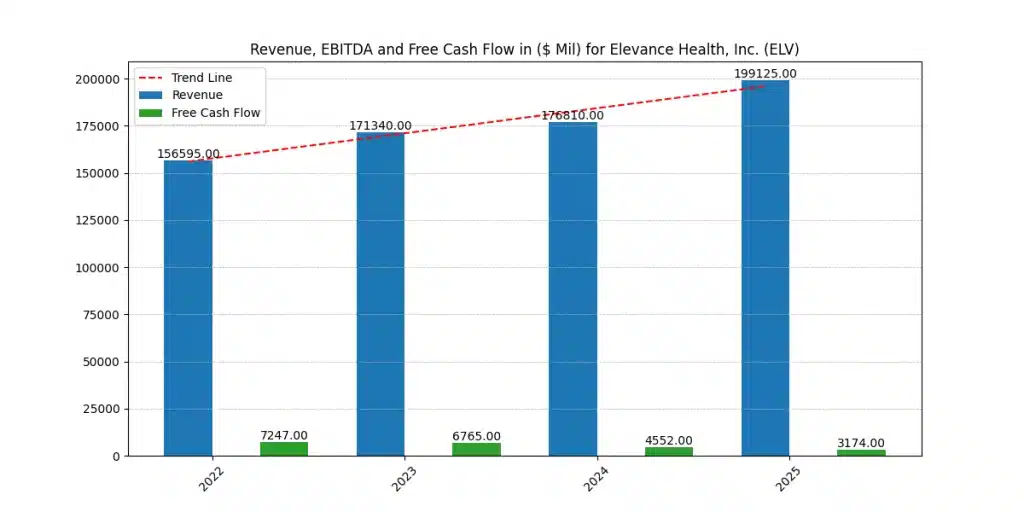
Figure 4. ELV revenue and free cash flow trend.
Revenue has increase for UNH to 400,278 (2024) from 287,597 (2021) ($millions). The free cash flow is high throughout the period that includes 19,889 (2021), 23,404 (2022), 25,682 (2023), and 20,705 (2024) ($m).
Revenue increases between 156,595 (2022) and 199,125 (2025) ($millions) for ELV. Nevertheless, ELV’s free cash flow decreases between 7,247 (2022) and 3,174 (2025) ($millions), indicating that the growth was accompanied by more intense cash requirements or more difficult operating environments for the years indicated.
Table 2: Revenue + cash flow
| Year | UNH Revenue ($m) | UNH Free Cash Flow ($m) | ELV Revenue ($m) | ELV Free Cash Flow ($m) |
| 2021 | 287,597 | 19,889 | — | — |
| 2022 | 324,162 | 23,404 | 156,595 | 7,247 |
| 2023 | 371,622 | 25,682 | 171,340 | 6,765 |
| 2024 | 400,278 | 20,705 | 176,810 | 4,552 |
| 2025 | — | — | 199,125 | 3,174 |
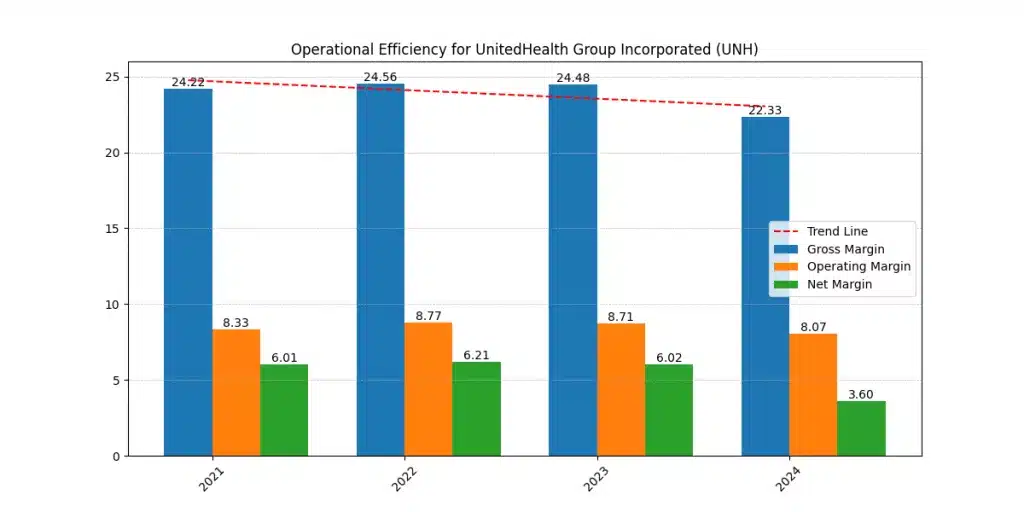
Figure 5. UNH margin trends (Gross, Operating, Net).
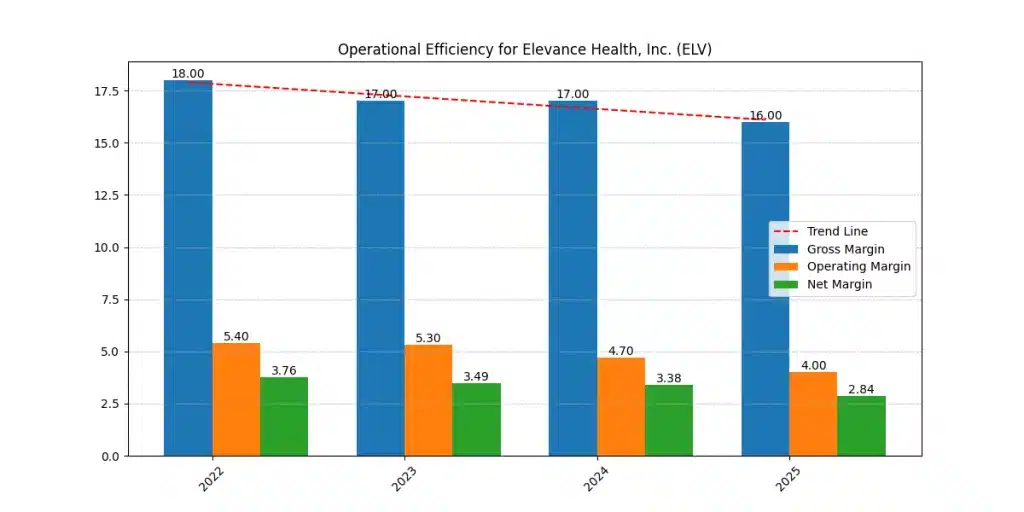
Figure 6. ELV margin trends (Gross, Operating, Net)
Operating Margins, Medical Loss Ratio, and Cost Pressures
Margins indicate the efficiency of a firm in converting revenue into profit as it struggles with the inflation of medical costs and utilization variance in case of healthcare companies.
From UNH margin
- Gross margin: 24.22 → 24.56 → 24.48 → 22.33 (2021–2024)
- Operating margin: 8.33 → 8.77 → 8.71 → 8.07
- Net margin: 6.01 → 6.21 → 6.02 → 3.60
From ELV margin:
- Gross margin: 18.00 → 17.00 → 17.00 → 16.00 (2022–2025)
- Operating margin: 5.40 → 5.30 → 4.70 → 4.00
- Net margin: 3.76 → 3.49 → 3.38 → 2.84
Table 3: Margin table
| Company | Period | Gross Margin | Operating Margin | Net Margin | Direction |
| UNH | 2021 → 2024 | 24.22 → 22.33 | 8.33 → 8.07 | 6.01 → 3.60 | Pressure in final year |
| ELV | 2022 → 2025 | 18.00 → 16.00 | 5.40 → 4.00 | 3.76 → 2.84 | Steady compression |
Meaning 2026: UNH continues to record a more favorable profitability base, however, the decreasing net margin is an indicator of how rapidly costs or policy changes can befall the outcomes. ELV compression is less acute but consistent but it is important since its valuation case requires better growth to be current price-justified.
Valuation Analysis: UNH vs ELV Stock Under 2%–8% Growth Scenarios
They demonstrate the level of change in intrinsic value in case the growth in the long run changes.
Intrinsic Value Sensitivity and Price per Share Outcomes
UnitedHealth Group (UNH)
Current Market Price Reference: ~$280
| Long-Term Growth Rate | Intrinsic Value per Share | Position vs Market Price |
| 2% | ~$272 | Slightly below market |
| 3% | ~$294 | Above market |
| 4% | ~$325 | Clearly above market |
| 5% | ~$370 | Strong upside vs market |
| 6% | ~$435 | Significant upside vs market |
UNH can be considered near the fair value in the range of 2-3 percentage growth that is a nominal GDP growth rate.
Elevance Health (ELV)
Current Market Price Reference: ~$347
| Long-Term Growth Rate | Intrinsic Value per Share | Position vs Market Price |
| 2% | ~$219 | Well below market |
| 3% | ~$222 | Well below market |
| 4% | ~$227 | Well below market |
| 5% | ~$234 | Well below market |
| 6% | ~$246 | Below market |
| 7% | ~$269 | Below market |
| 7.5% | ~$292 | Below market |
| 8% | ~$340 | Slightly below market |
ELV is valued at very high growth rate in the long term, and UNH looks fairly valued at a given 2-3% moderate growth.
Market-Implied Growth: What Is Already Priced In?
The fastest way to read market-implied growth is to find the point of intrinsic curve which is touching the present price line.
- In the case of UNH, the market price point would seem to be near the 2%-3% range of the intrinsic value, which means that the investors might already be valuing a more difficult environment. That is a good thing for the future returns, in case the company stabilizes performance the upside will be huge.
- On ELV, the current price line is already over the top of the sensitivity curve, suggesting that the market is already requiring a growth path, which is hard to maintain on the part of a mature insurer unless margins can widen substantially.
ELV Stock vs UNH Stock: Expected Returns Through 2030
It relies on trend: margin behavior, direction of cash flow and sensitivity to valuation.
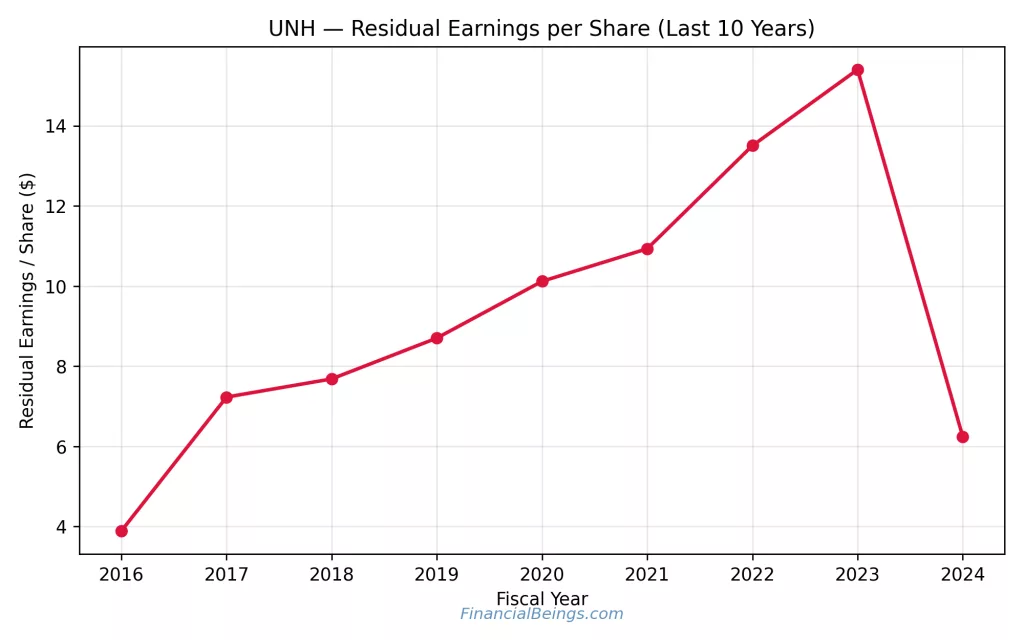
Figure 7. UNH residual earnings per share (10-year trend).
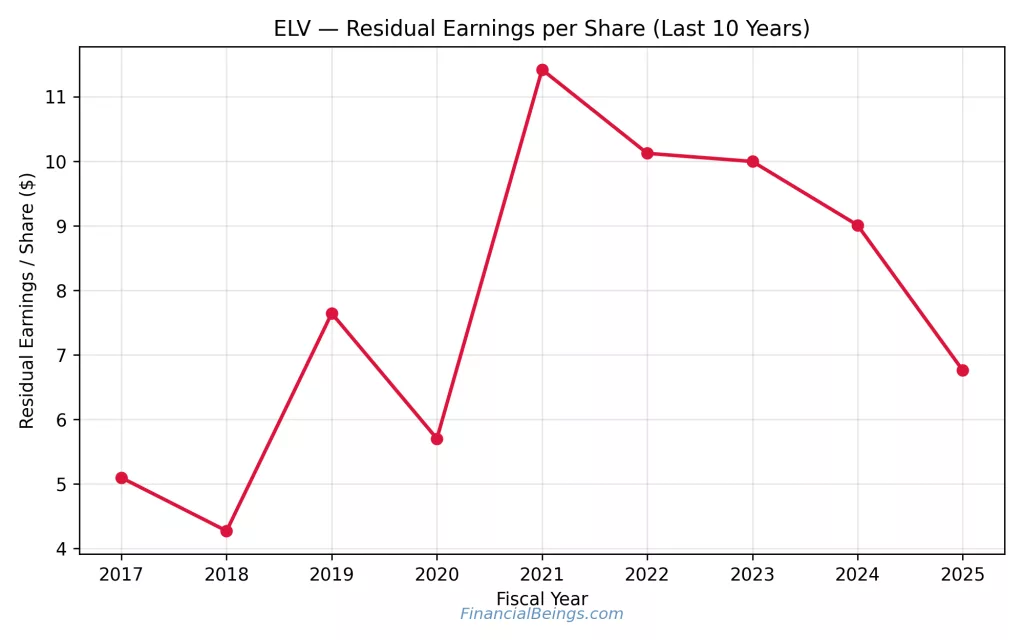
Figure 8. ELV residual earnings per share (10-year trend).
Base Case: Moderate Growth and Normalized Returns
In the base cases, the two companies experience a stable growth and the medical cost pressure is normalized. In that case, UNH is better off since valuation will indicate that it can justify the current price without unsustainable growth assumptions.
In the base case, ELV can still operate, although, has a weaker long-term growth trajectory to support present pricing. That is, ELV base-case is more reliant on operational performance (cost control and margin recovery).
Bull Case: Margin Expansion and Policy Stability
A bull case occurs when there is good control on utilization, supportive reimbursement and good performance by the companies.
- UNH bull case: Intrinsic curve is increasing at a sharp rate between 4 percent and 6 percent. As long as UNH is able to stabilize residual earnings, and maintain operating margins within its historical range, the valuation upslope is significant.
- ELV bull case: ELV should have high growth and margin repair since the price line is already demanding it. ELV can bridge that valuation gap of Carelon expansion and improved insurance pricing power that revive margins.
Downside Case: Regulatory or Cost Inflation Shock
This is the situation that investors should consider in 2026. CMS has emphasized a net average proposed decrease of 0.09% in Medicare Advantage payments in 2027 and still strives to resolve the issue of payment accuracy and risk adjustment design (CMS, 2026).
In a downside case, the claims trend, stricter reimbursement or change in coding/risk adjustment increase on the part of the insurers.
Risk Assessment in 2026: Regulatory, Reimbursement, and Medical Cost Exposure
The threat that the policy environment changes more rapidly than the pricing one is the largest common threat to UNH vs ELV stock. The reason why Medicare Advantage payment updates and risk adjustment regulations are important is that they alter the manner in which revenue gets generated, and not the manner in which costs are managed.
According to CMS 2027 Advance Notice, the net average payment increase is proposed to be 0.09% and emphasizes constant adjustments that will increase payment accuracy and sustainability (CMS, 2026). Concurrently, market reaction indicates that the insurer’s values are sensitive to even minor suggested modifications in MA payment direction (Financial Times, 2026).
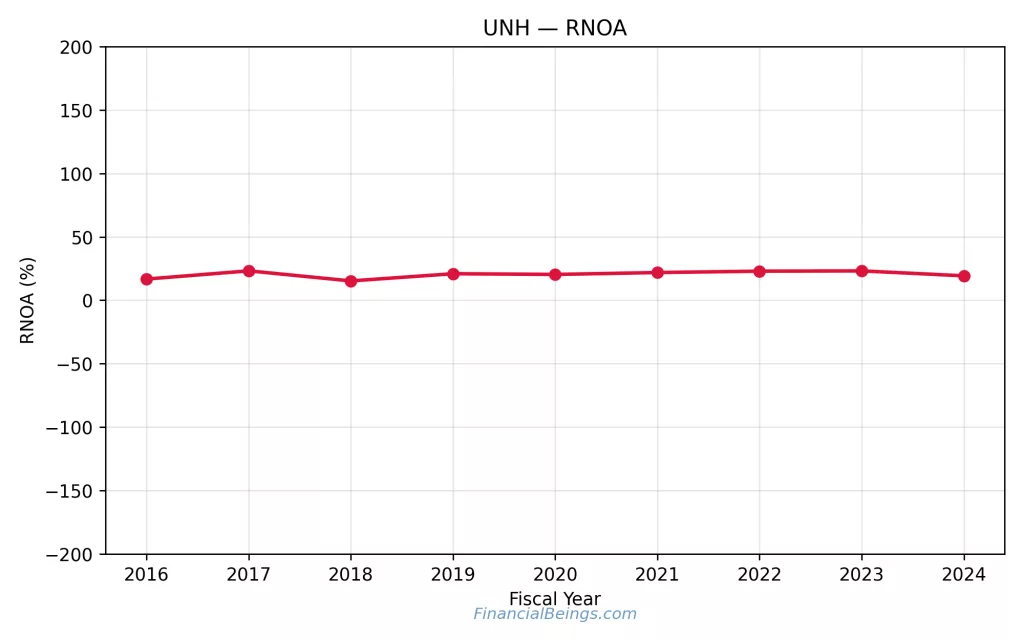
Figure 9. UNH RNOA trend (sustainable profitability view).
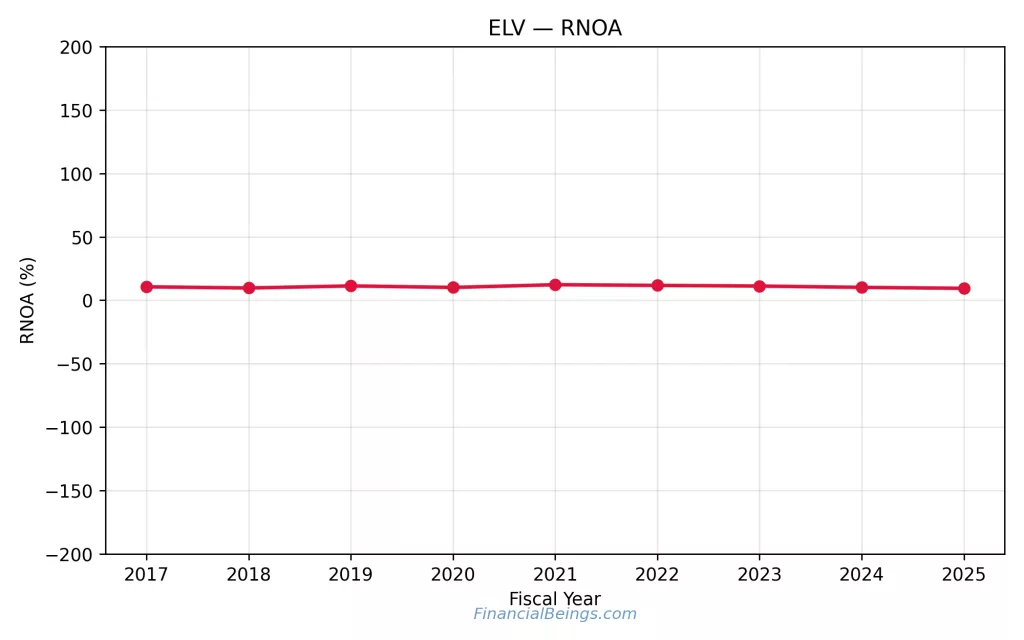
Figure 10. ELV RNOA trend (sustainable profitability view).
Dividend Strength and Capital Allocation Strategy
Both UNH and ELV are proven dividend payers, and present continuous dividend payouts and consistent capital returns common to seasoned healthcare leaders (Yahoo Finance, 2026).
It is not the amount of payout that is of interest to the investor but rather reliability. This is a typical situation in a year where margins and residual earnings are stressed the less risky dividend profile is the one with more consistent cash flow. UNH free cash flow remains high whereas ELV free cash flow reduces throughout the period presented.
Portfolio Fit: Growth, Balanced, or Conservative Portfolio?
Growth-tilted portfolio
UNH is better fitted since the valuation curve provides an upside in case growth returns to moderate-plus rates, whilst the current price is further below the low growth intrinsic value.
Balanced portfolio
UNH also appeals to investors requiring income as well as growth, and UNH is more robust in operating margin structure, although policy headlines have to be closely followed on the part of investors.
Conservative Portfolio
UNH is more suitable to this portfolio type as its intrinsic value covers most of its current market capitalisation even at a lower growth rate of 2-3% while ELV is a risky play at the current market price.
Final Verdict: Is UNH or ELV the Smarter Buy in 2026?
Why UNH is the smarter buy in 2026?
This is because of valuation realism: UNH sensitivity implies that the market price is more aligned with value when there is modest growth, whereas ELV sensitivity implies that very high growth is needed in the long run to warrant the current price. Meanwhile, the profitability indicate that UNH is more successful in the level of operation margin and the cash-flow indicates greater levels of free cash flow support throughout the period depicted.
ELV may even win on the condition of performing a real bull case (good growth and margin recovery), but according to valuation, it has more disappointment space (Less to no margin of safety). As the payment policy of Medicare Advantage increases the cost pressure and remains a live issue in 2026, the stock with a greater valuation cushion is the more risk-adjusted option (CMS, 2026; Financial Times, 2026).
All calculations and valuation estimates are FinancialBeings’ own, based on data sourced from SEC filings of UNH (10K and 10Q) and ELV (10K and 10Q), use or reproduction before prior approval is prohibited.
Usama Ali
Usama Ali is the founder of Financial Beings and a self-taught investor who blends classic valuation study with insights from psychology. Inspired by works from Benjamin Graham, Aswath Damodaran, Stephen Penman, Daniel Kahneman, and Morgan Housel, he shares independent, data-driven research to help readers connect money, mind, and happiness.
Disclaimer
The content provided herein is for informational purposes only and should not be construed as financial, investment, or other professional advice. It does not constitute a recommendation or an offer to buy or sell any financial instruments. The company accepts no responsibility for any loss or damage incurred as a result of reliance on the information provided. We strongly encourage consulting with a qualified financial advisor before making any investment decisions.


