Are you interested in AI stocks to buy now? The hype surrounding artificial intelligence (AI) has given way to reality, changing how companies function, compete, and expand. AI is currently the foundation of global corporate strategies and plays a key role in decisions that impact whole industries, rather than being limited to experimental projects. AI is proving to be a disruptive force in the global economy, offering tailored customer experiences, improved analytics, and the ability to automate repetitive tasks.
For businesses, integrating AI is about creating long-term competitive advantages rather than just increasing productivity. Companies can improve marketing efficacy, streamline supply chains, make quicker and more accurate decisions, and access entirely new revenue streams by leveraging AI-driven insights. As the companies that become experts in AI present themselves as the long-term beneficiaries of the digital age, investors interpret this transformation as a structural shift in market value.
Amid this transition, five companies stand out as the indisputable leaders. In addition to embracing AI, Microsoft (MSFT), Meta Platforms (META), NVIDIA (NVDA), Alphabet (GOOGL), and Amazon (AMZN) are integrating it into their fundamental business strategies. NVIDIA is the foundation of AI computer hardware; Alphabet is incorporating AI into search, ads, and cloud; Amazon is implementing AI in retail, AWS, and logistics; Microsoft is integrating AI into corporate software and cloud services; and Meta is using it to increase advertising efficiency.
These five “AI Giants” are working together to shape the direction of technology and present investors with the most alluring prospects in this quickly growing market. As the data demonstrates, they are establishing the norms for how AI adds value rather than merely adjusting to it. They are, therefore, the most important AI stocks to buy right now.
Microsoft (MSFT): AI at Enterprise Scale
Microsoft has established itself as the leader in enterprise adoption of AI. According to Microsoft 2024, its Copilot features in Dynamics, GitHub, Azure OpenAI, and Microsoft 365 effortlessly integrate into productivity tools and provide recurring subscription revenue streams.
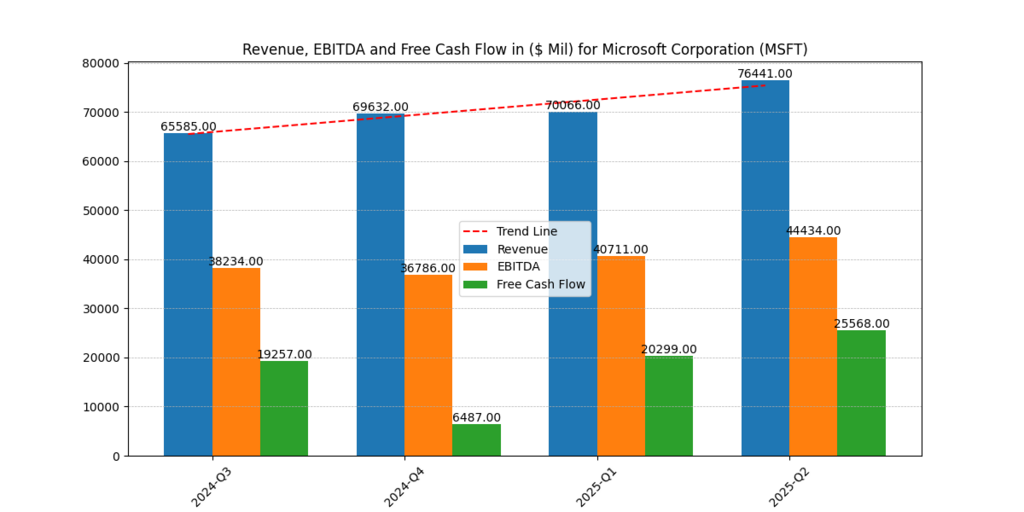
Figure 1: Microsoft Quarterly Revenue, EBITDA, and Free Cash Flow (2024–2025).
| Metric | Value |
| 2025 VAE | $10.84 |
| 2026 VAE | $13.42 |
| VAE Growth | +23.8% |
| No-Growth PPS | $153–184 |
| Growth PPS | $600 |
| ROE 2026 | 33% |
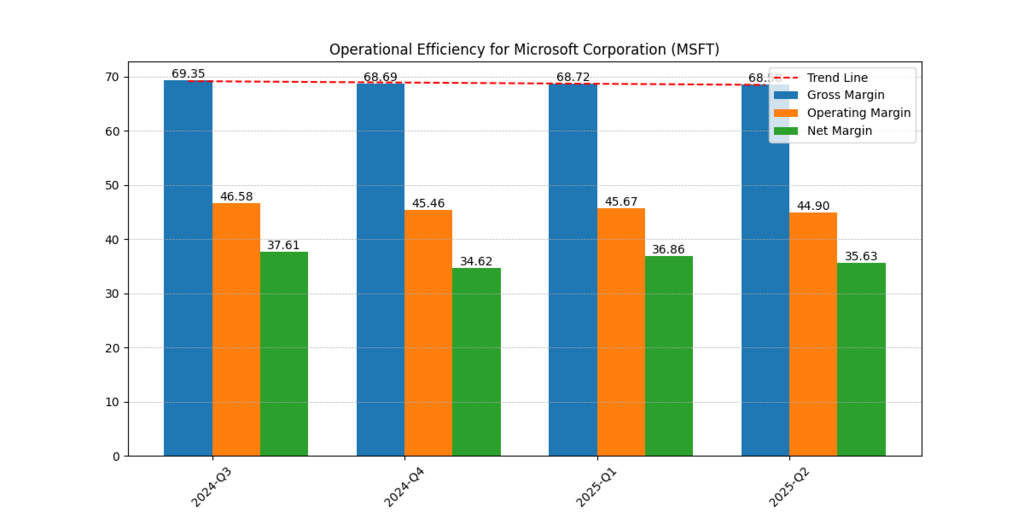
Figure 2: Microsoft Gross, Operating, and Net Margins (2024–2025).
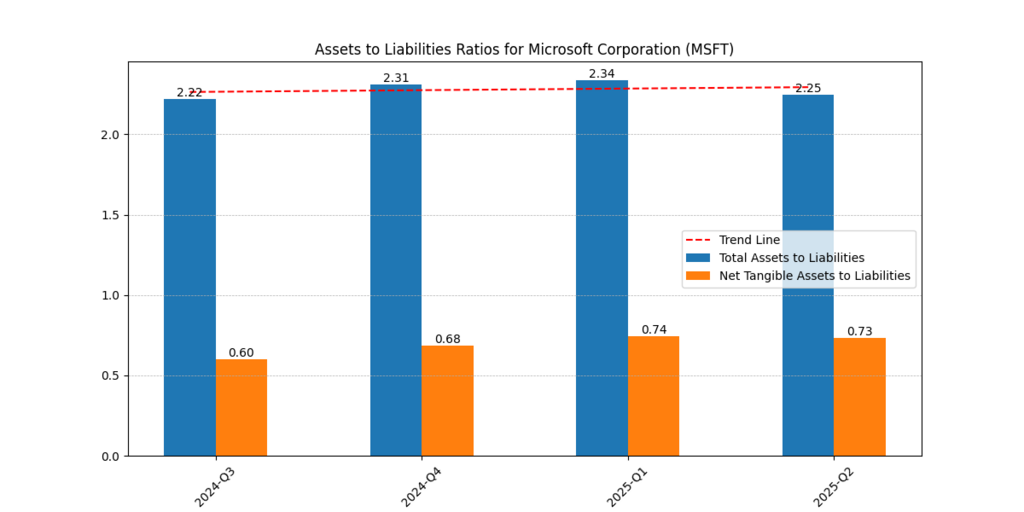
Figure 3: Microsoft Total and Net Tangible Assets-to-Liabilities Ratio.
Additionally, Microsoft maintains a ROE of 32.5% (TTM), operating margins close to 45%, and gross margins between 68 and 69%. Revenues increased steadily from $65.6 billion in 2024-Q3 to $76.4 billion in 2025-Q2, indicating enterprise adoption.
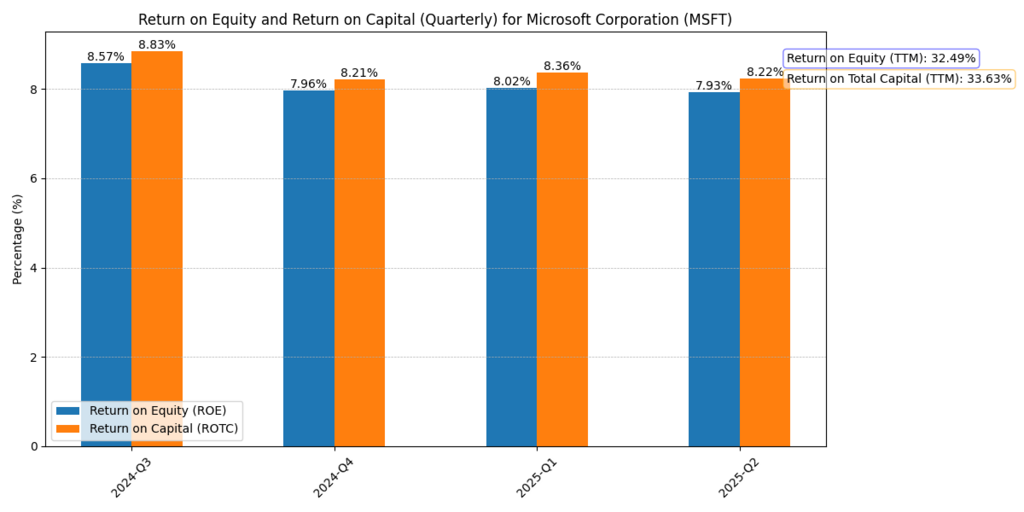
Figure 4: Microsoft Return on Equity (ROE) and Return on Total Capital (ROTC), TTM.
The subtle compounding of Microsoft is the problem. The slow-burning benefits of subscription monetization are sometimes underestimated by investors because it lacks the headline thrill of NVIDIA’s meteoric expansion. Keeping investors disciplined involves avoiding recency bias and concentrating on long-term VAE growth.
Meta Platforms (META): AI as an Ad Yield Engine
By enhancing targeting, automating campaign creation, and increasing advertiser ROI, Meta leverages AI stocks to buy now to maximise advertising yield. Ad efficiency is rising due to Advantage+ campaigns and AI-powered content control (Statista, 2024).
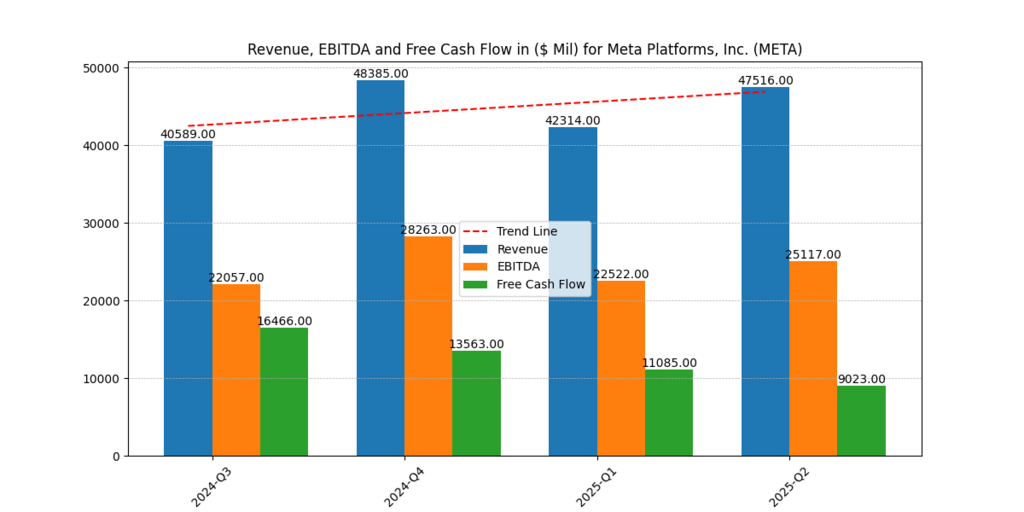
Figure 5: Meta Platforms Quarterly Revenue, EBITDA, and Free Cash Flow (2024–2025).
| Metric | Value |
| 2025 VAE | $20.85 |
| 2026 VAE | $22.17 |
| VAE Growth | +6.3% |
| No-Growth PPS | $305 |
| Growth PPS | $858 |
| ROE (TTM) | 39% |
| ROTC (TTM) | 35% |
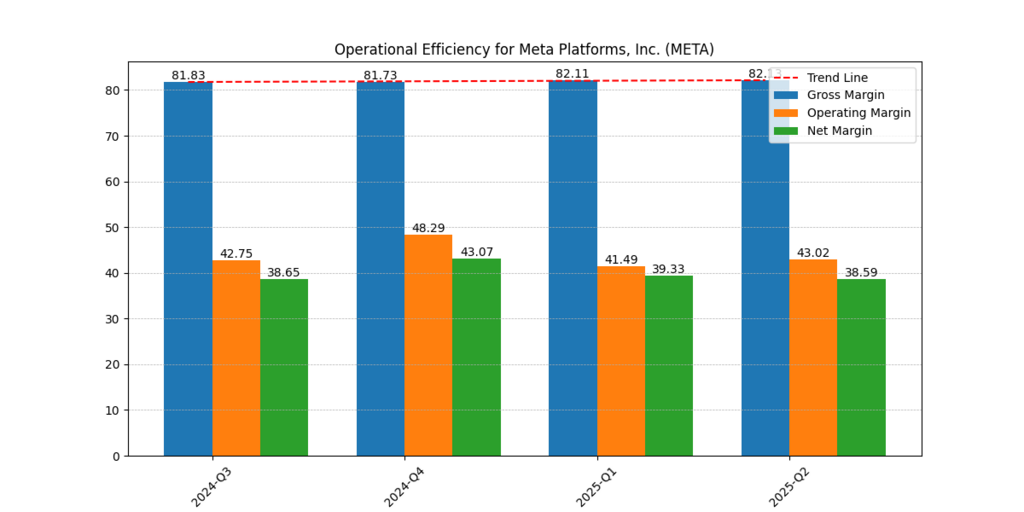
Figure 6: Meta Gross, Operating, and Net Margins.
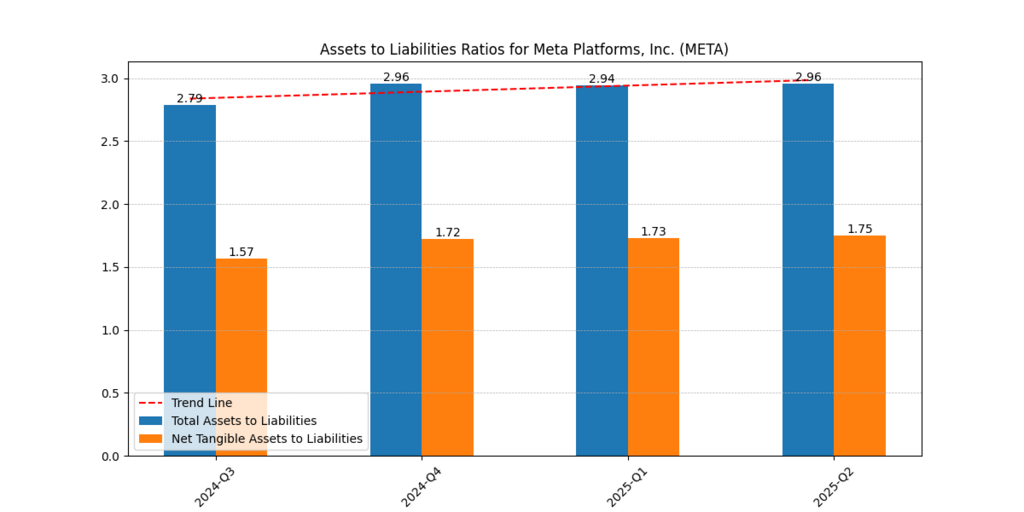
Figure 7: Meta Total and Net Tangible Assets-to-Liabilities Ratio.
With gross margins of over 82%, operating margins of about 41–48%, and net margins of about 39–43%, Meta continues to be among the most profitable companies in the computer industry. Revenues increased to $47.5 billion in 2025-Q2 from $40.6 billion in 2024-Q3.
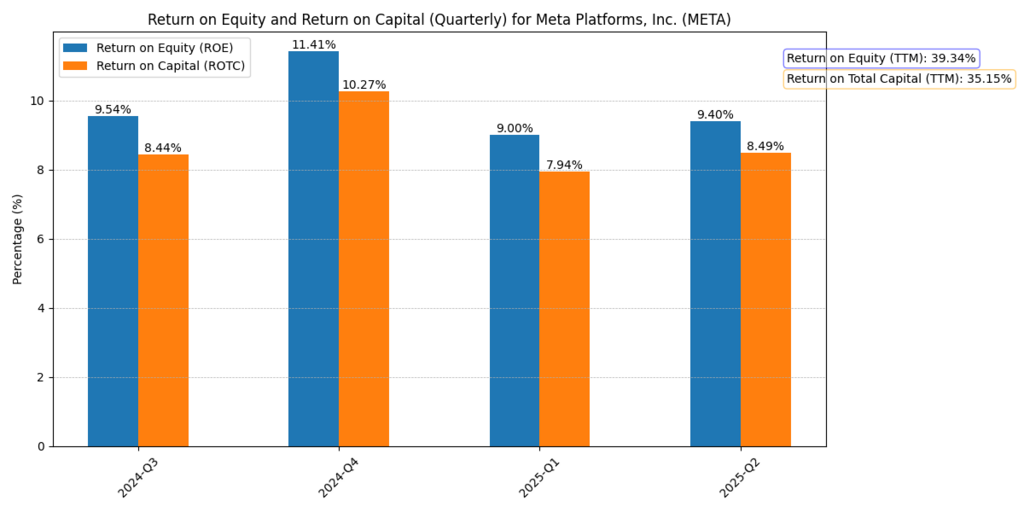
Figure 8: Meta Return on Equity (ROE) and Return on Total Capital (ROTC), TTM.
Anchoring bias is frequently brought on by Meta’s significant capital expenditures on AI infrastructure; investors become fixated on high upfront costs without considering the yield increases. Nonetheless, the data favours long-term compounding when operating margins are higher than 40%.
NVIDIA (NVDA): The Compute Backbone of AI
Adoption of AI continues to directly benefit NVIDIA. Training and inference workloads are dominated by its GPUs and networking hardware, but switching costs are increased by CUDA and software libraries (Reuters, 2025).
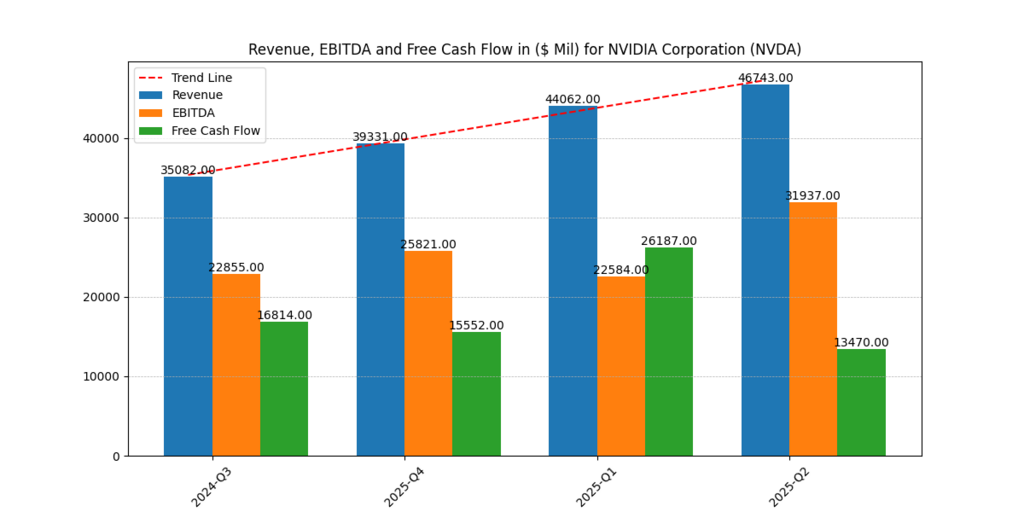
Figure 9: NVIDIA Revenue, EBITDA, and Free Cash Flow Growth (2022–2025).
| Metric | Value |
| 2025 VAE | $3.97 |
| 2026 VAE | $5.42 |
| VAE Growth | +36% |
| No-Growth PPS | $50 |
| Growth PPS | $203 |
| ROE 2026 | 1.69 |
| ROTC 2026 | 94.1% |
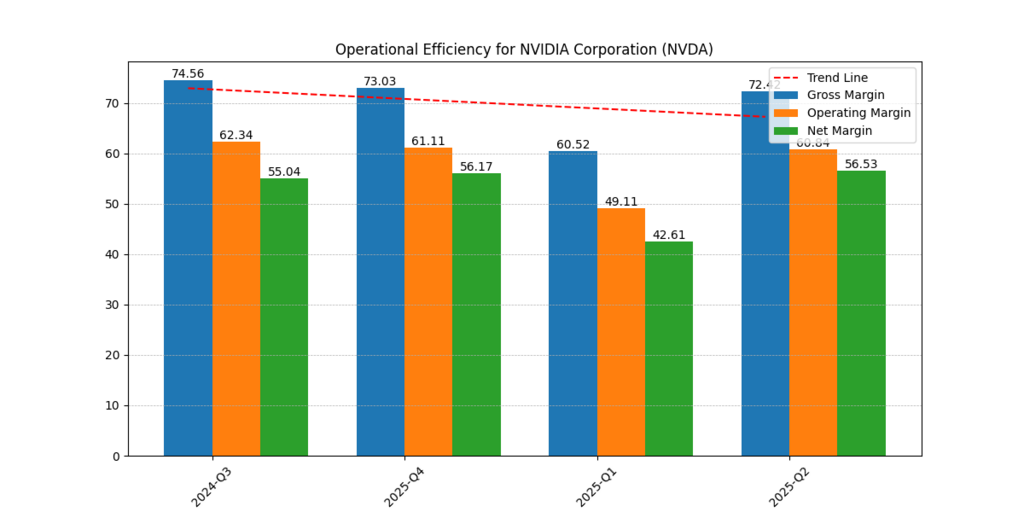
Figure 10: NVIDIA Gross, Operating, and Net Margin Expansion (2022–2025).
NVIDIA’s sales increased from $27 billion in 2023 to $130.5 billion by 2025. EBITDA surged to $86.1 billion, while net margins came close to 56%. These figures demonstrate exceptional operating leverage.
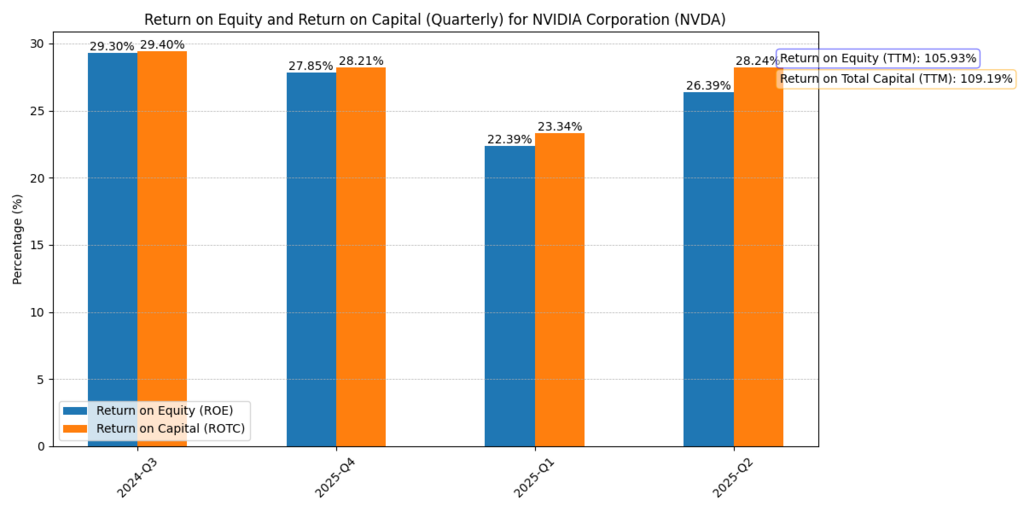
Figure 11: NVIDIA Return on Equity (ROE) and Return on Total Capital (ROTC).
Investors pursue momentum during demand peaks and panic at supply bottlenecks, as demonstrated by NVIDIA. However, the secular AI thesis is unaffected as long as ROTC stays above 90% and margins beyond 50%.
Alphabet (GOOGL): AI Across Search, Ads, and Cloud
Google Cloud AI services, YouTube recommendations, and Google Search are all part of Alphabet’s AI monetisation strategy (Financial Times, 2024). The business defends its ad market share while integrating AI stocks to buy now into user experiences.
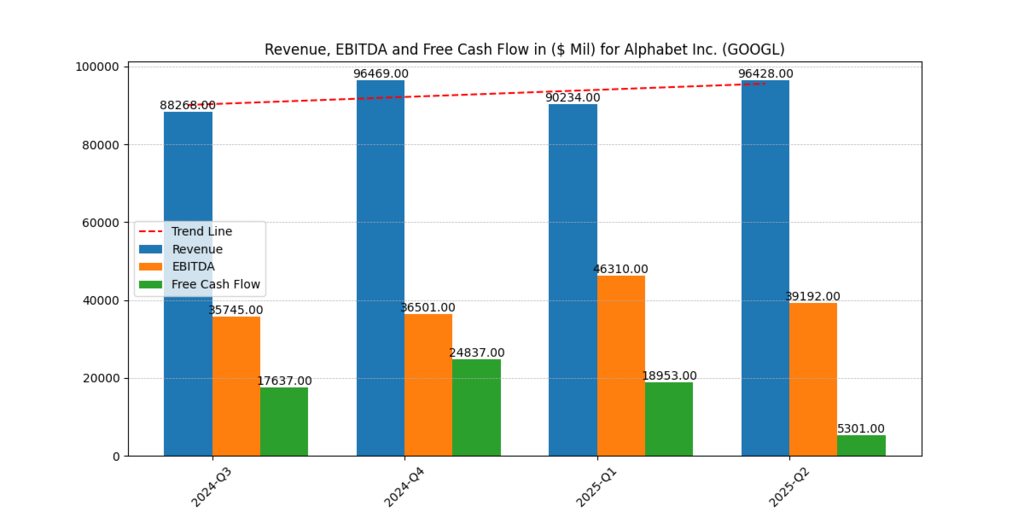
Figure 12: Alphabet Quarterly Revenue, EBITDA, and Free Cash Flow (2024–2025).
| Metric | Value |
| 2025 VAE (in %) | 7.19% |
| 2026 VAE (in %) | 7.61% |
| VAE Growth | +5.8% |
| Price Prediction PPS (Unlevered) | $223 |
| No-Growth PPS | $99 |
| ROE 2025 | 39.84% |
| ROE 2026 | 39.57% |
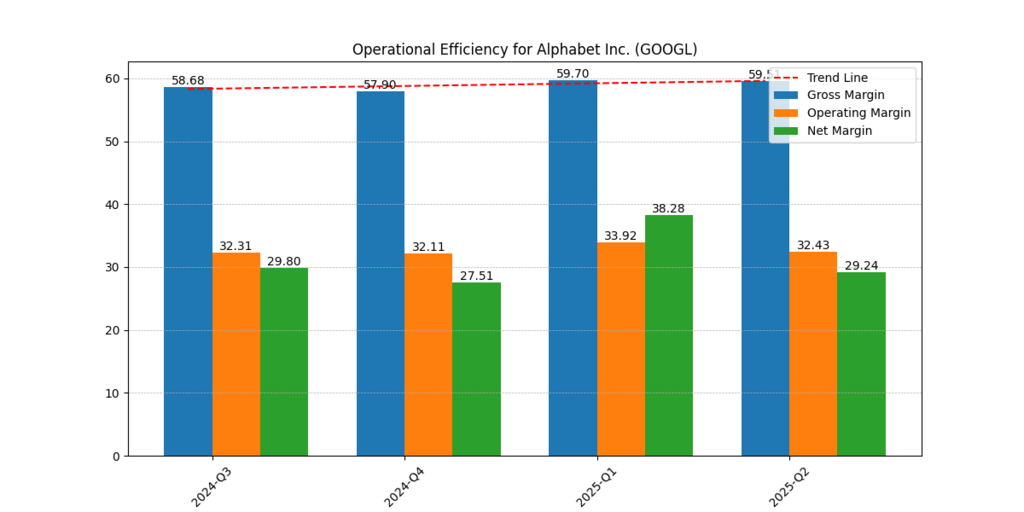
Figure 13: Alphabet Gross, Operating, and Net Margins.
In the first quarter of 2025, Alphabet recorded $90.2 billion in revenue and $46.3 billion in EBITDA. Operating margins of about 33% and gross margins of about 59–60% support its long-term viability.
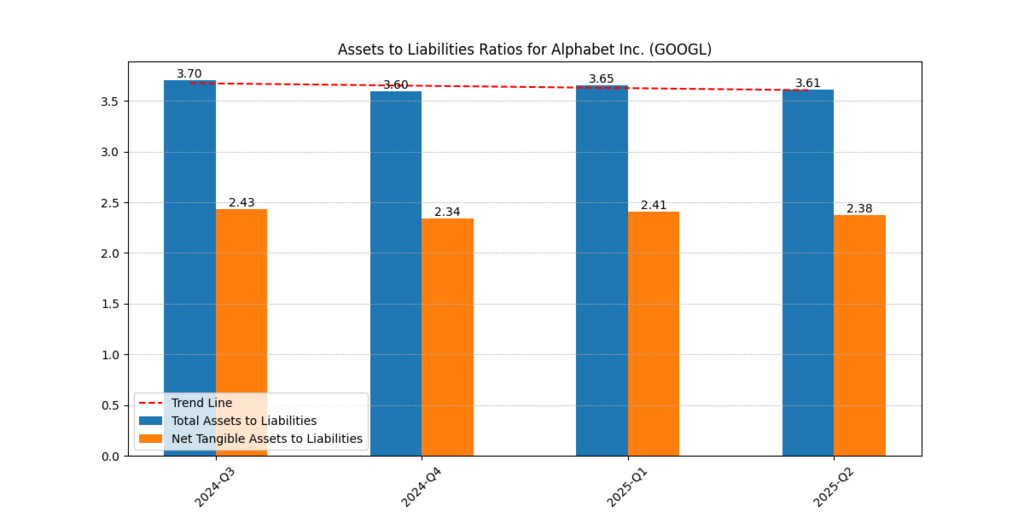
Figure 14: Alphabet Total and Net Tangible Assets-to-Liabilities Ratio.
Investors in Alphabet are prone to recency bias, which causes them to overreact to fluctuations in short-term search revenue. Alphabet is still a strong AI play, though, with fortress-level A/L ratios (~3.6–3.7) and steady profitability.
Amazon (AMZN): AI in Retail, Cloud, and Ads
AI is used by Amazon in digital advertising, AWS cloud services, and personalised retail. Scalable AI infrastructure is offered by AWS, and AI-powered logistics increase cost effectiveness (Bloomberg, 2025).
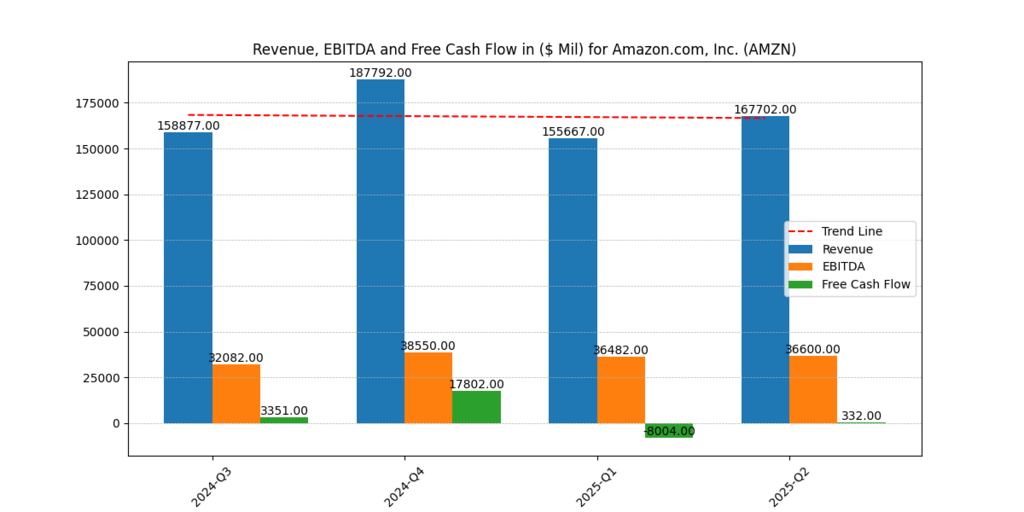
Figure 15: Amazon Revenue, EBITDA, and Free Cash Flow (2024–2025).
| Metric | Value |
| 2025 VAE | $3.91 |
| 2026 VAE | $4.42 |
| VAE Growth | +13% |
| No-Growth PPS | $72 |
| Growth PPS | $259 |
| ROE (TTM) | 23.9% |
| ROTC (TTM) | 19.9% |
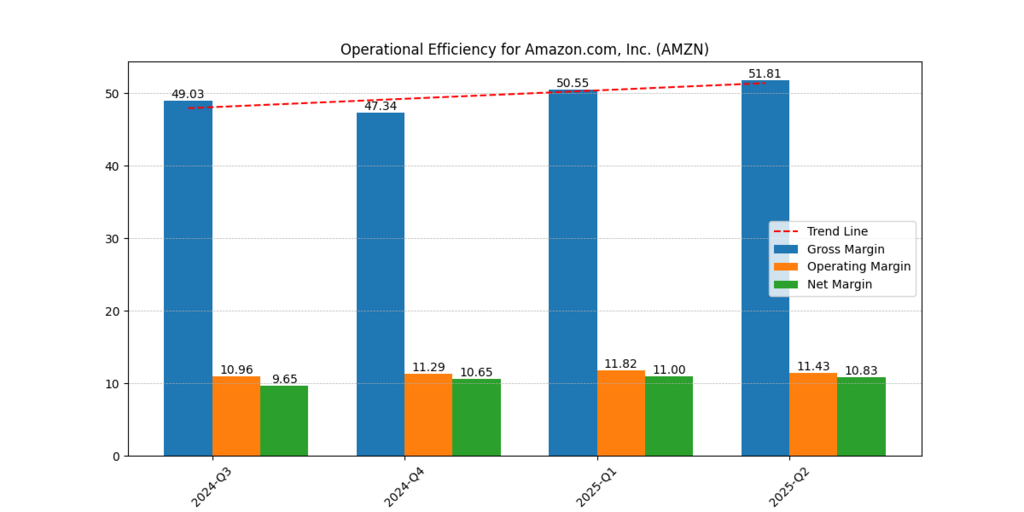
Figure 16: Amazon Gross, Operating, and Net Margins.
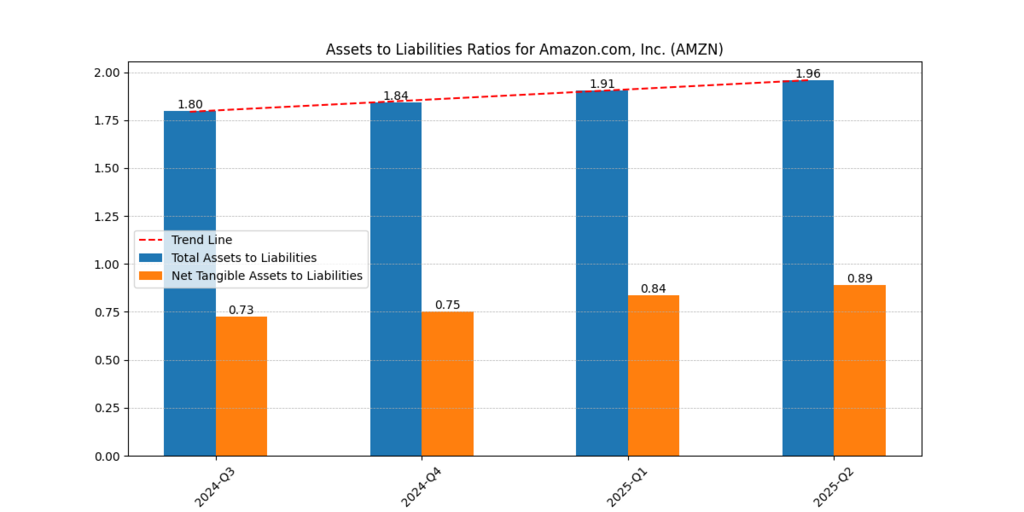
Figure 17: Amazon Total and Net Tangible Assets-to-Liabilities Ratio.
In recent quarters, revenues ranged from $155.7 billion to $187.8 billion, while gross margins improved to 51.8%. A stronger financial profile is indicated by operating margins (~11%) and increasing VAE growth.
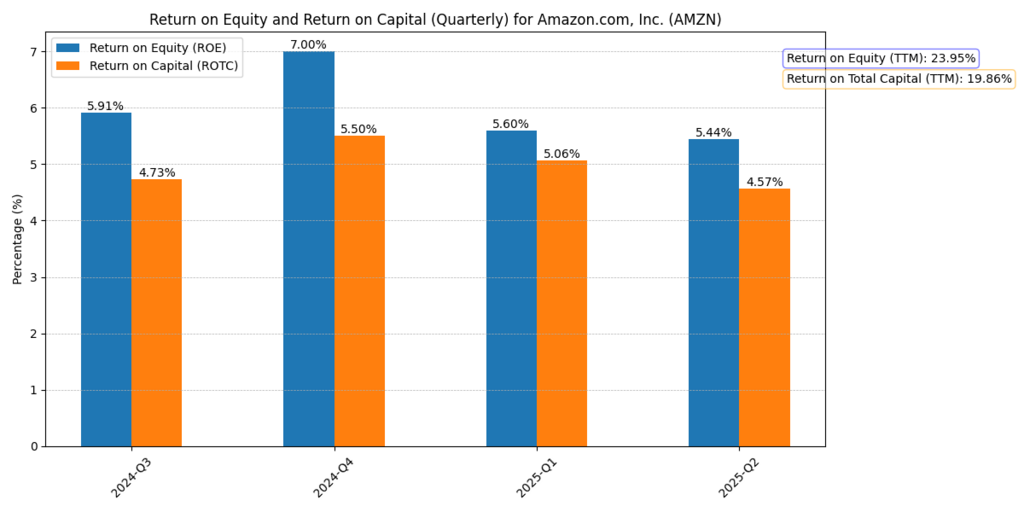
Figure 18: Amazon Return on Equity (ROE) and Return on Total Capital (ROTC), TTM.
Short-termism sometimes causes Amazon investors to overemphasize retail profits while undervaluing AWS and Ads. However, the long-term theory is still valid due to resilient A/L ratios (1.80 → 1.96) and improving VAE.
Consolidated VAE & Price Predictions
| Company | 2025 VAE | 2026 VAE | VAE Growth Rate | Price Prediction (Price per Share) | No-Growth Price per Share |
| MSFT | $10.84 | $13.42 | +23.8% | $600 | $153–$184 |
| META | $20.85 | $22.17 | +6.3% | $858 | $305 |
| NVDA | $3.97 | $5.42 | +36% | $203 (Raised after Q2 Earnings) | $50 |
| GOOGL | 7.19% | 7.61% | +5.8% | $223 | $99 |
| AMZN | $3.91 | $4.42 | +13% | $259 | $72 |
Further Reading : Expert Insights on the 4 Biggest AI Stocks Fundamental Analysis: Best Value Investing Principles!
Conclusion
For investors, each of the five AI stocks to buy now in 2025 offers distinct yet complementary prospects. Through enterprise subscriptions, integrating AI into cloud services and productivity, and generating steady, recurring revenue, Microsoft keeps adding value.
Meta is demonstrating how machine learning can optimise both engagement and monetisation by immediately converting AI innovation into increased advertising yield. Because of its supremacy in GPUs and data centre technology, NVIDIA, the undeniable computing backbone of the AI revolution, offers enormous growth potential. By integrating AI into a variety of platforms, including Google Cloud, YouTube, and search, Alphabet ensures resiliency through a range of revenue streams. Lastly, by implementing AI concurrently across digital advertising, AWS cloud services, and retail personalisation, Amazon fortifies its position and develops a potent multi-engine monetisation approach.
Investors must see past market noise and temporary euphoria from the standpoint of behavioural finance. Reacting to short-term profit fluctuations, flocking into momentum trades, or basing decisions on headline capital expenditure announcements can all skew logical judgment. Rather, monitoring Value Added Earnings (VAE) growth, return on equity (ROE), return on total capital (ROTC), and balance-sheet resilience are the true pillars of wise investment choices. These financial indicators show whether integrating AI is increasing real shareholder value or only fueling speculation.
Disclaimer
The content provided herein is for informational purposes only and should not be construed as financial, investment, or other professional advice. It does not constitute a recommendation or an offer to buy or sell any financial instruments. The company accepts no responsibility for any loss or damage incurred as a result of reliance on the information provided. We strongly encourage consulting with a qualified financial advisor before making any investment decisions.