A Comparitive Analysis of the Top 5 AI Companies 2025 – A Comparative Study of NVDA, MSFT, GOOGL, META, and AVGOHow much value are AI companies really generating for shareholders? The comparison of NVDA, MSFT, GOOGL, META, and AVGO on the criteria of AI business models, capital discipline, and long-term valuation to reveal the Top AI Companies in USA is provided within the framework of this investor-level examination.
Introduction
Artificial intelligence has become the new narrative of the equity markets in the global market. But history in the market has shown abundantly that technological leadership is not a foolproof method of getting high returns to the shareholders. Investors who discover the Top 5 AI Companies are likely to confuse the distinction between innovation and value creation, and fail to consider the financial mechanics that would ultimately determine the eventual long-term performance. Just like any disruptive technology, AI does not scale the methods of current business; it does not overthrow capital constraints, competition, or valuation discipline.
The following article will provide a comparative presentation of the top AI companies with a specific focus on NVIDIA (NVDA), Microsoft (MSFT), Alphabet (GOOGL), Meta Platforms (META), and Broadcom (AVGO). The research does not rank these firms according to the sophistication of the AI but rather compares the effects of the adoption of AI on capital intensity, operating efficiency, ROIC, and sensitivity of valuation. Such a difference is crucial because a company that appears as exposed to AI as much can show much different economic outcomes when the capital-related necessities and reinvestment processes are considered.
Visible growth is always placed on the reward and underweight capital durability in the markets. The rise in revenue, as with the example of AI infrastructure suppliers, creates a powerful impression of assurance and thus the urge of the investors to extrapolate the NVDA vs MSFT vs GOOGL AI performance that was experienced the previous year into the future. In the meantime, more discrete forms of value creation, like margin stabilization, balance-sheet leverage, and marginal increase in efficiency, are typically discounted because they do not make the headlines. This bias is further enhanced by the AI cycles that favor the firms in which the AI demand can be most easily observed when the economy is weaker.
It is this asymmetry of action that makes a company like NVIDIA enjoy extreme valuation premia, and it is that Microsoft, Alphabet, Meta, and Broadcom are normally valued in a manner that underestimates the value of AI in improving existing financial systems of these businesses.
Structural Divide
The first significant observation, based on the evidence, is the structural distance between AI infrastructure vs AI platform firms. AI hardware, networking, and custom silicon get monetized by infrastructure vendors such as NVIDIA and Broadcom. Their growth is therefore closely connected to the cycles of the customer capital expenditure that are surging and high in the reinvestment. The platform companies, such as Microsoft, Alphabet, and Meta, are in the existing ecosystems where they have the ability to implement AI to the existing ecosystems to maximize the efficiency of monetization, price power, and cost organization.
The platform companies, in their turn, generate less emotional value of incremental margin growth and balance-sheet leverage that is more likely to be sustainable. This is where the entire NVIDIA, Microsoft, Alphabet, Meta, and Broadcom analysis begins.
NVIDIA (NVDA)
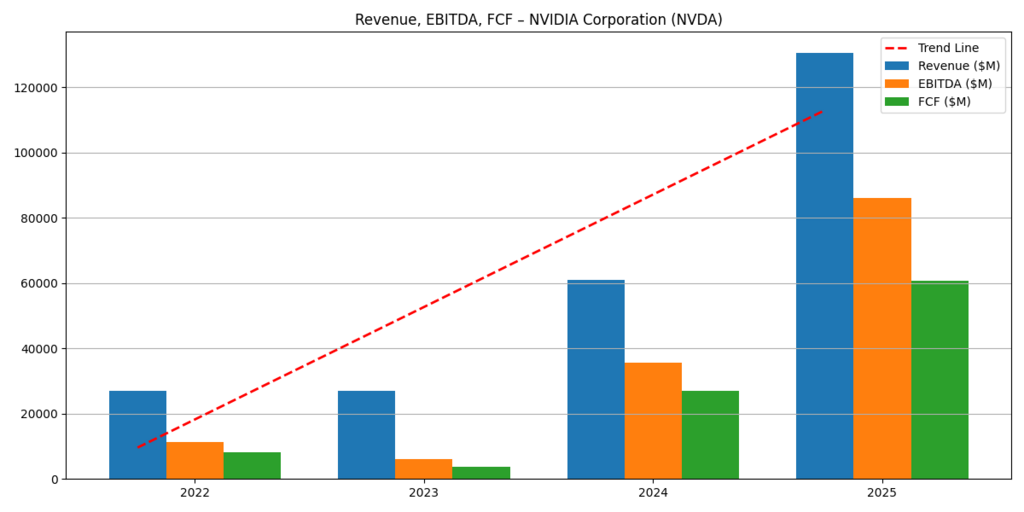
Figure 1: Revenue, EBITDA, and Free Cash Flow – NVIDIA Corporation
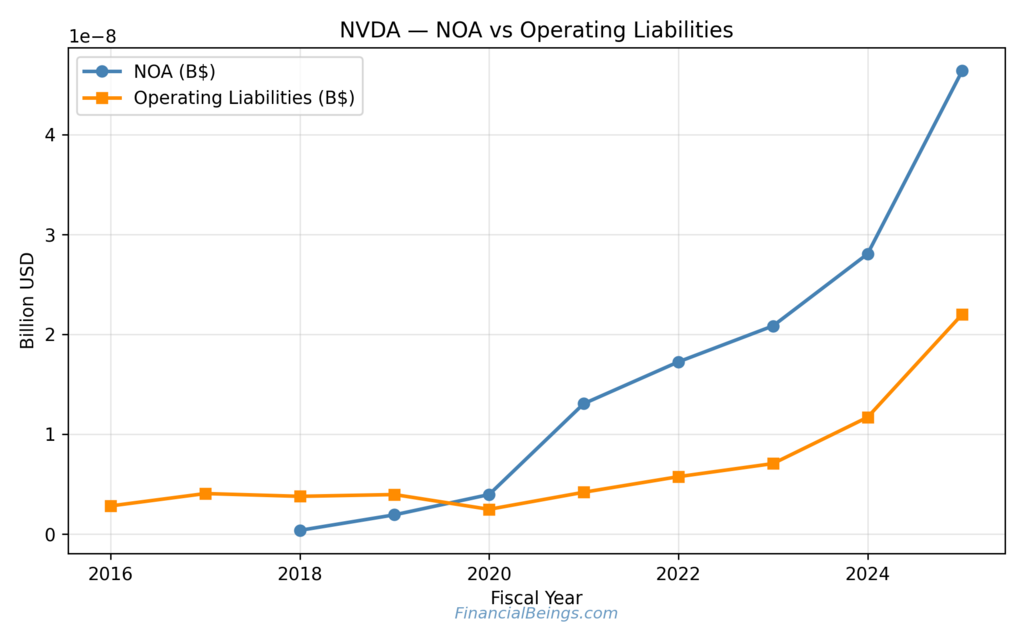
Figure 2: Net Operating Assets vs Operating Liabilities – NVIDIA Corporation
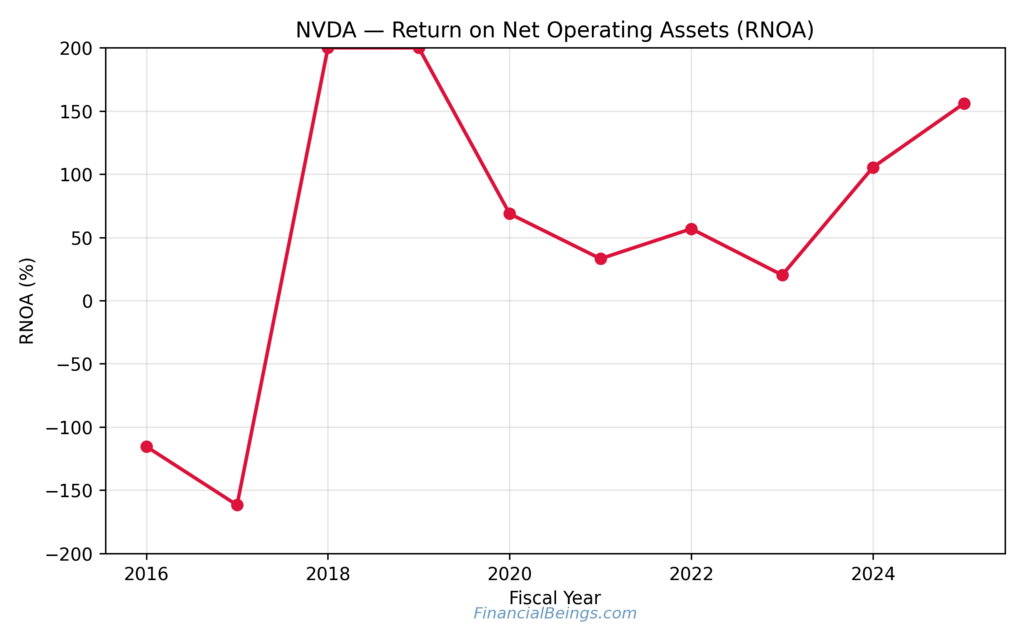
Figure 3: Return on Net Operating Assets (RNOA) – NVIDIA Corporation
The NVIDIA financial narrative outlines the most interesting AI narrative. To grow to approximately USD 27 billion in 2022 and over USD 130 billion in 2025, revenues also increase, and EBITDA and free cash flow also increase. This trend is evidence that the demand for AI has become the cash flow rather than the accounting growth as such.
The increase in net operating assets is also very high, and the increase in operating liabilities is lower, meaning that the increase in NVIDIA growth is financed through an increase in the balance sheet as compared to supplier financing or deferred revenue. It is a common attribute of capital-intensive growth.
The RNOA profile supports this meaning. NVIDIA has the greatest RNOA when the demand for AI is high, and the least when the asset base is increasing. This instability is reflective of the economic reality of the high-infrastructure returns at the initial phases of the adoption cycle and plateaus as the competition level and reinvestment level increase. This creates valuation weakness to investors: even a change in long-term growth expectations can greatly affect intrinsic value.
Table 1: NVIDIA key Financial Indicators
| Year | Revenue (USD bn) | EBITDA (USD bn) | Free Cash Flow (USD bn) |
| 2022 | ~27 | ~11 | ~8 |
| 2023 | ~27 | ~6 | ~4 |
| 2024 | ~61 | ~35 | ~27 |
| 2025 | ~130 | ~86 | ~61 |
NVIDIA should therefore be included in the list of the Best AI stocks 2025 for those investors well versed in the capital cyclicality, the reinvestment risk, and valuation sensitivity.
Microsoft (MSFT)
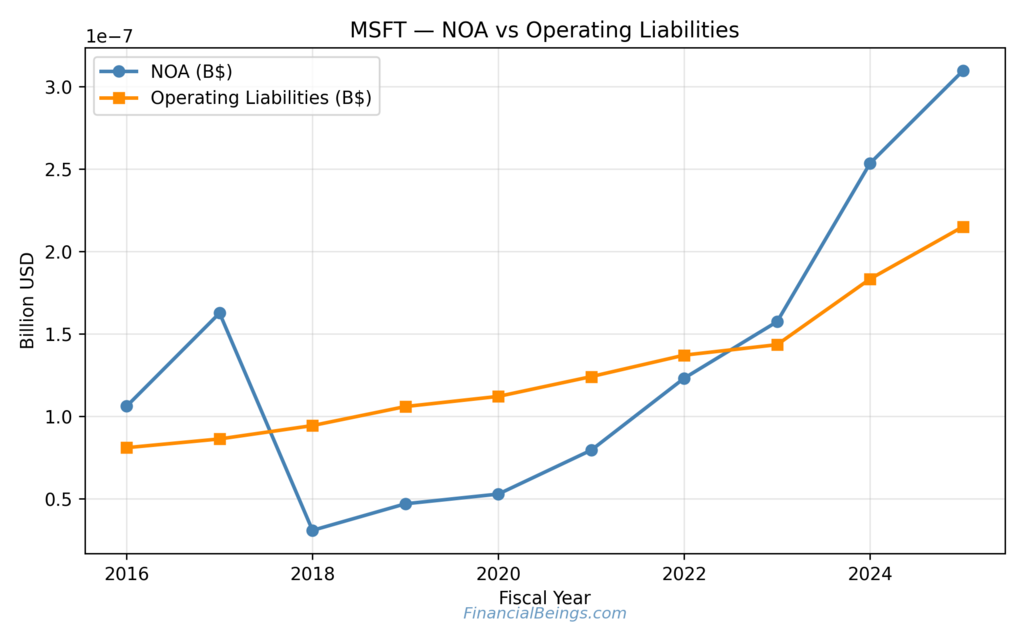
Figure 4: Net Operating Assets vs Operating Liabilities – Microsoft Corporation
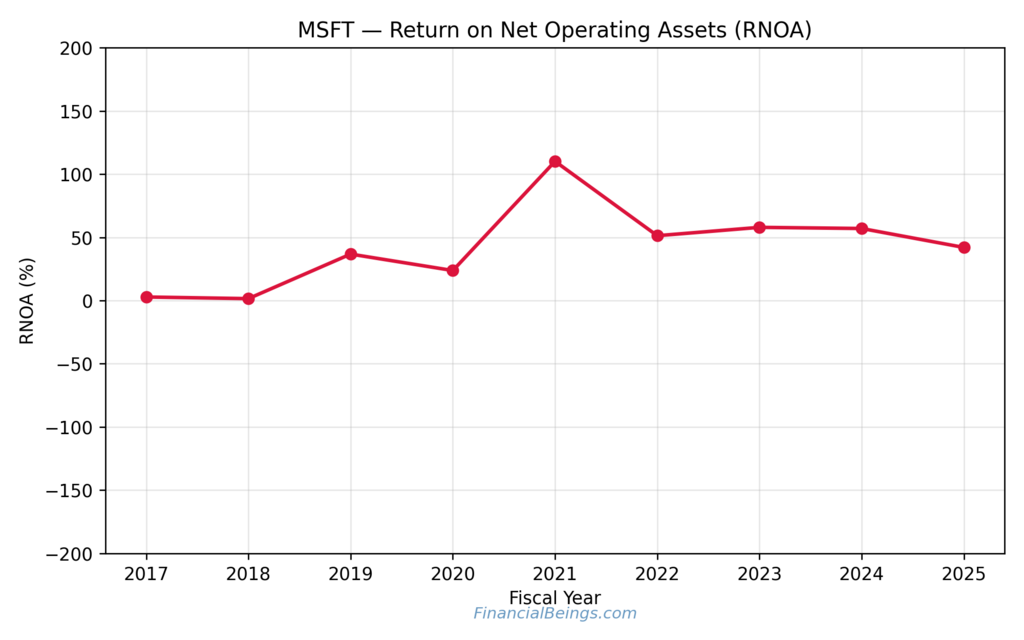
Figure 5: Return on Net Operating Assets (RNOA) – Microsoft Corporation
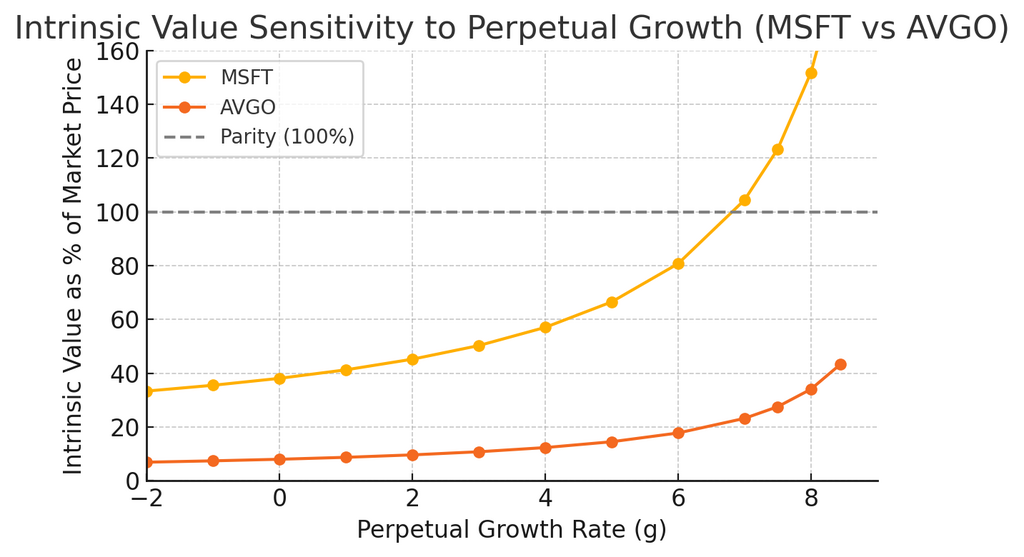
Figure 6: Intrinsic Value Sensitivity to Perpetual Growth – MSFT vs AVGO
The other AI financial profile is Microsoft, which is vastly different. It also increases its NOA with time, but more on, its operating liabilities equally increase. It has become such a trend that Microsoft is now funding the growth of the deferred revenue, ecosystem size, and contractual cash flows instead of encumbering its balance sheet (Microsoft Corporation, internal financial database).
RNOA also records a quality and stable operating profitability that is a sign of a high operating profitability of over 100 percent, and then stabilizes between 45-60 percent. The returns of Microsoft, unlike NVIDIA, do not decrease as the assets rise; this implies that AI does not grow the current lines of business, yet the capital required to create the business is on its way up.
Intrinsic value is also sensitive enough to justify why Microsoft appeals to long-term investors. Even quite minor assumptions of perpetual growth possess significant upside in their value, but a very low sensitivity to downside. Microsoft behaviorally can have the perquisite of asymmetric payoff because in this instance, the shareholders will know that the implementation of AI is capable of introducing optionality without compromising capital discipline in any sense.
Microsoft is financially organized to an extent that it is regarded as one of the strongest rivals in the list of Best AI stocks 2025.
Alphabet (GOOGL)
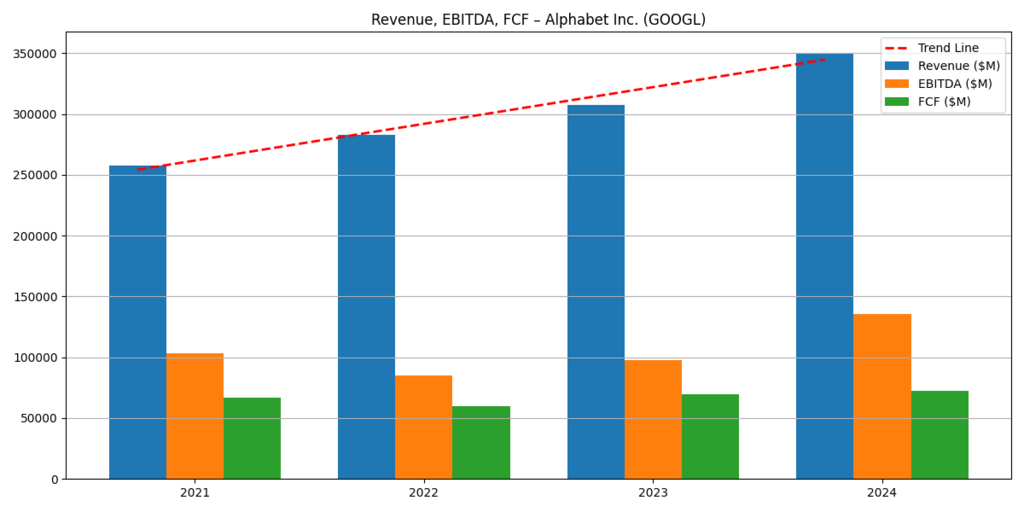
Figure 7: Revenue, EBITDA, and Free Cash Flow – Alphabet Inc.
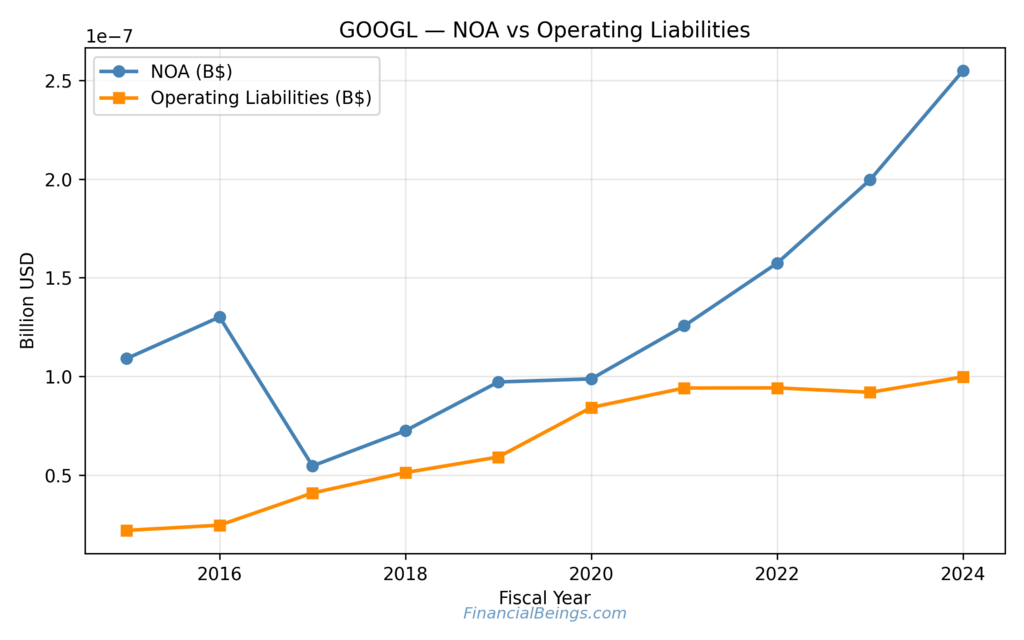
Figure 8: Net Operating Assets vs Operating Liabilities – Alphabet Inc.
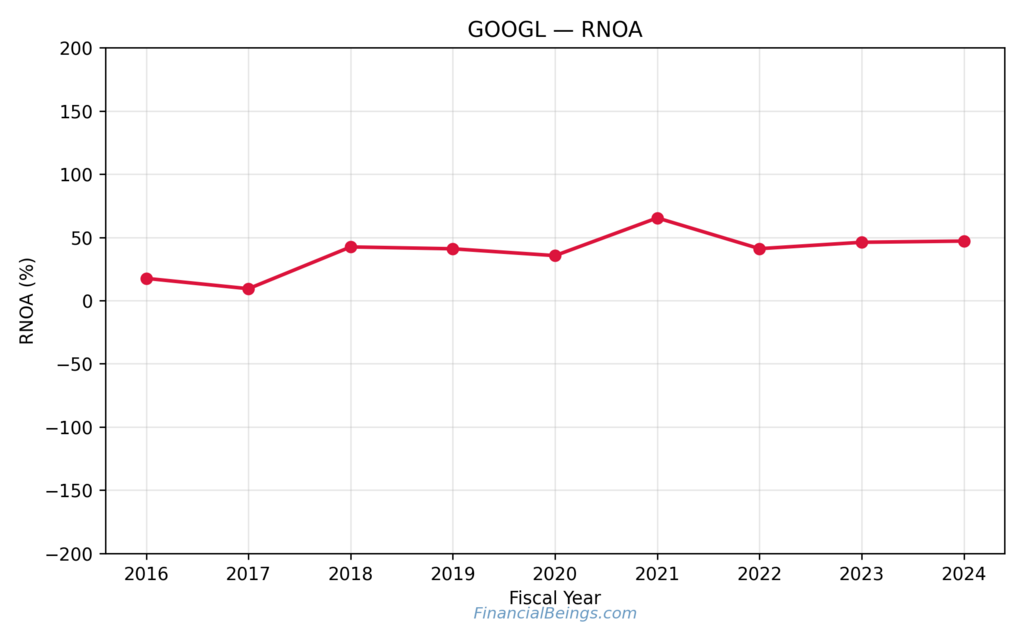
Figure 9: Return on Net Operating Assets (RNOA) – Alphabet Inc.
The Alphabet represents AI as an efficiency machine, rather than a growth engine that is capital-intensive. The revenues increase continuously between the figures, nearly USD 256 billion in 2021 and the sizes slightly less than USD 350 billion in 2024, but the figures of EBITDA and free cash flow undergo a temporary drop and start increasing at an impressive rate.
The development of NOA is moderate, and an increase in operating liabilities is keeping the reinvestment in control. The platform of RNOA is relatively stable, with 40-60% which indicates high economic profitability regardless of the cycles.
Table 2: Alphabet Operating Performance
| Year | Revenue (USD bn) | EBITDA (USD bn) | Free Cash Flow (USD bn) |
| 2021 | ~256 | ~103 | ~67 |
| 2022 | ~282 | ~85 | ~60 |
| 2023 | ~308 | ~98 | ~69 |
| 2024 | ~350 | ~135 | ~73 |
Investors in AI cycles often underestimate Alphabet because the returns of the company are incremental, not explosive. This stability, however, is what makes Alphabet attractive to the long-term valuations of AI stocks: it is possible to improve the margins and cash flow with AI, without interfering with the balance sheet.
Meta Platforms (META)
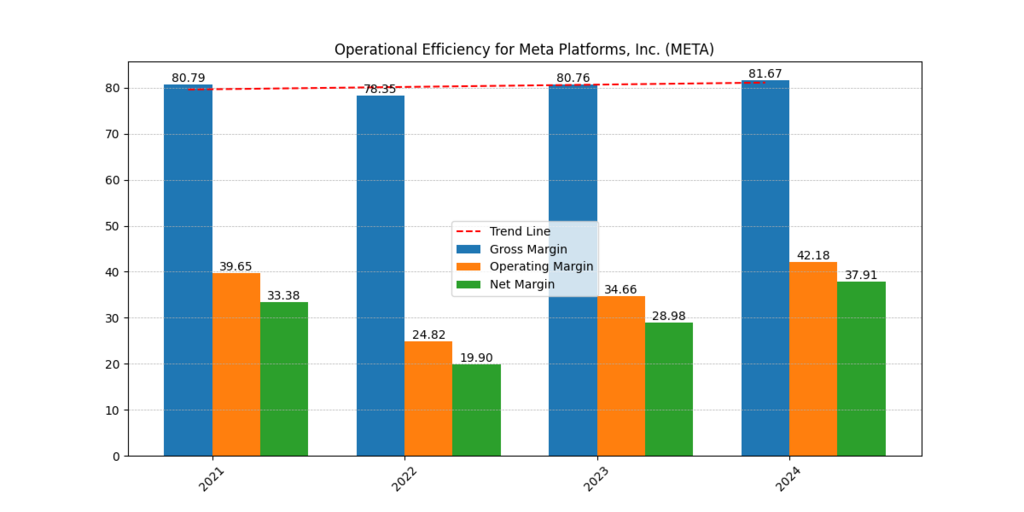
Figure 10: Gross, Operating, and Net Margins – Meta Platforms, Inc.
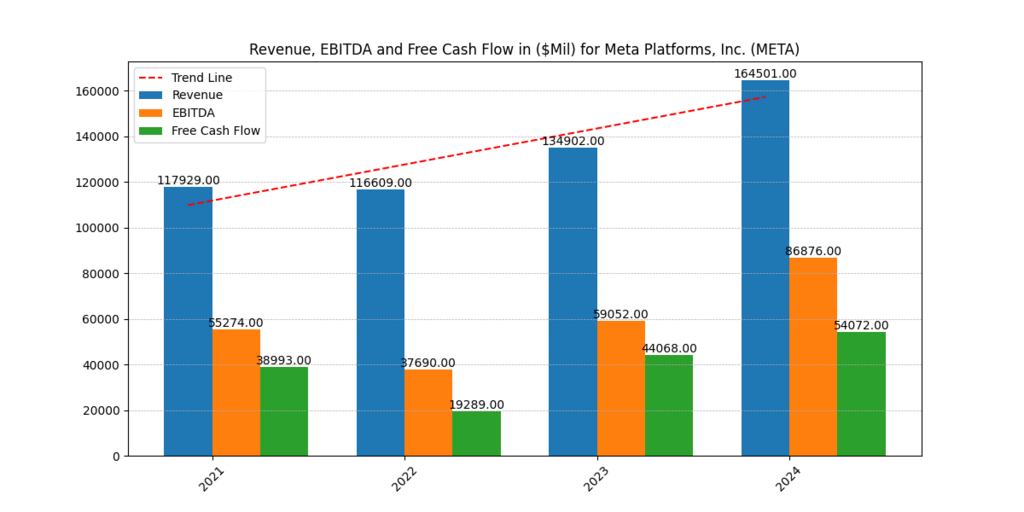
Figure 11: Revenue, EBITDA, and Free Cash Flow – Meta Platforms, Inc.
The AI story of Meta was also very different in comparison to the infrastructure and traditional platform story. The asset-to-liabilities ratios are near 3, and gross margins are always greater than 80% which is considered a structurally robust operating model.
Although the revenue is volatile relative to quarter to quarter, both EBITDA and free cash flow are good. Meta utilizes AI in the majority of cases to enhance the targeting of ads, ranking of content, and cost management rather than aggressive growth. This has been reflected in the stabilization of operating margins and high returns on capital.
From an investor perspective, Meta is a victim of sentiment mean reversion. The company had been made to learn from overinvestment and, having been punished, it had maintained its credibility by being disciplined. In this instance, AI is an operating leverage multiplier, but not a hypothetical growth multiplier, and therefore, Meta is a risk-adjusted competitor on the list of the Best AI stocks 2025 (Meta Platforms, Inc.).
Broadcom (AVGO)
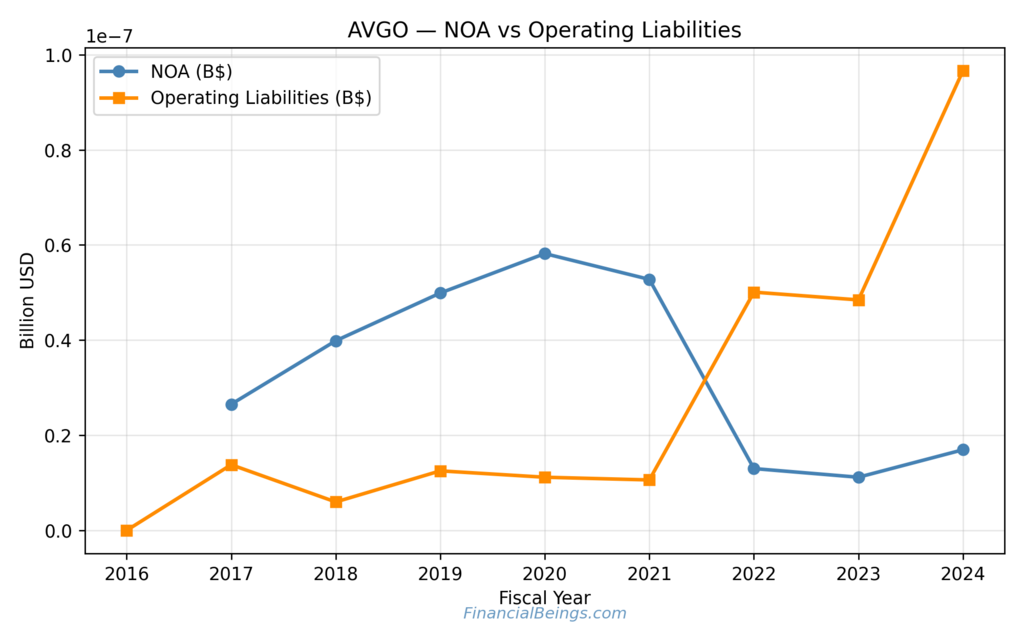
Figure 12: Net Operating Assets vs Operating Liabilities – Broadcom Inc.
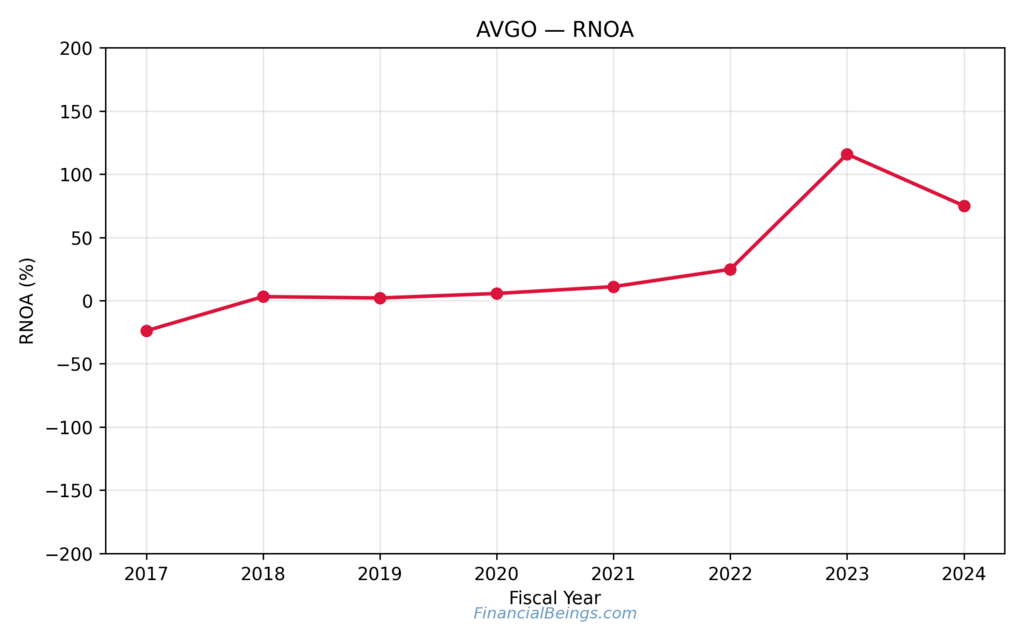
Figure 13: Return on Net Operating Assets (RNOA) – Broadcom Inc.
Broadcom has financial health that reflects capital discretion. The net operating assets are very high in the year approximately 2020, and then net operating assets start decreasing, and the operating liabilities are also increasing significantly. This increase in mechanical change increases RNOA, which reaches a high of over 100 percent in the later years.
The intrinsic value of Broadcom does not have growth assumptions sensitivity when compared to NVIDIA. Low elasticity of valuation is a good quality for investors who desire to be exposed to AI without excessive risk of decline. The selective and pricing-based AI role assumed by Broadcom focuses on the sustainability of returns and not growth.
Comparative Synthesis and Investment Implications
Table 3: Cross-Company AI Economics Comparison
| Company | AI Role | Capital Intensity | RNOA Stability | Investor Profile |
| NVDA | Infrastructure | Very High | Volatile | High-risk growth |
| MSFT | Platform | Moderate | Stable-High | Long-term compounder |
| GOOGL | Platform | Moderate | Stable | Defensive efficiency |
| META | Platform | Low–Moderate | Improving | Turnaround efficiency |
| AVGO | Hybrid | Low | Mechanically High | Capital preservation |
The most advanced models are not the Best AI stocks 2025, but the ones that use AI without taking the capital discipline road. Each of the strengths and weaknesses of AI is multiplied; therefore, the financial structure is more important than the prediction of innovation.
Further Reading : Nvidia vs Google Stock: Which Tech Titan Is the Better Buy for 2026?
Further Reading : AVGO vs MSFT Stock Analysis 2026: Which One Is the Better Buy at Current Market Prices?
Further Reading : Best Stocks to Buy for Long Term Growth Before 2025 Ends, Not Just Tech Stocks
Further Reading : Meta Stock Forecast 2025: Breaking Down META’s True Value Beyond the Market Hype
Conclusion
The evidence comparison of NVIDIA, Microsoft, Alphabet, Meta Platforms, and Broadcom reveals that even the leaders in the market could not produce one investment result that was created by artificial intelligence. The financial performance of individual companies that use AI in another economic framework, and the variations, makes a tangible difference in long-term returns to the stockholders. The nearest AI competitor is NVIDIA, with extraordinarily high growth in revenue and cash flow, but its operating asset base is expanding rapidly, resulting in the strain to reinvest, and hence, future returns are becoming more vulnerable to capital discipline. The value creation by it is therefore strong, but valuation and cyclical-based.
Microsoft is at the opposite side of the AI spectrum. Rather than commercializing AI as a stand-alone item, it integrates AI into common software and cloud architecture, which produces and perpetuates recurring cash flows and structural operating liabilities. It enables Microsoft to absorb AI investment devoid of any considerable alteration in the returns on operating assets, and therefore, the exposure to AI is not so sensitive to the perpetual increase in capital. Alphabet also follows the same path but is more efficiency-driven, where it uses AI as a tool to defend and increase margins of search, advertising, and cloud services.
The fact that it has a persistent profile of returns is a sign that AI is a productivity multiplicator and not a growth accelerant, which does not have such a dramatic effect but contributes to the strength in valuation.
These five companies are assembled to indicate that AI only enhances the underlying business models, which are already there, and do not replace them. NVIDIA improves the likelihood of growth and reinvestment, Microsoft and Alphabet concentrate on scale and efficiency, Meta applies AI to operational discipline, and Broadcom relies on return stability more than expansion. This is a self-evident piece of advice to investors, given that AI will not bring long-term value to those who simply name the technological leaders, but to those who understand how the financial structure of each firm will cause AI investment risk and returns to increase or decrease shareholder returns.
All calculations and valuation estimates are FinancialBeings’ own, based on data sourced from SEC filings NVDA (10K and 10Q), MSFT (10K and 10Q), META (10K and 10Q), GOOGL (10K and 10Q) and AVGO (10K and 10Q), use or reproduction before prior approval is prohibited.
Usama Ali
Usama Ali is the founder of Financial Beings and a self-taught investor who blends classic valuation study with insights from psychology. Inspired by works from Benjamin Graham, Aswath Damodaran, Stephen Penman, Daniel Kahneman, and Morgan Housel, he shares independent, data-driven research to help readers connect money, mind, and happiness.
Disclaimer
The content provided herein is for informational purposes only and should not be construed as financial, investment, or other professional advice. It does not constitute a recommendation or an offer to buy or sell any financial instruments. The company accepts no responsibility for any loss or damage incurred as a result of reliance on the information provided. We strongly encourage consulting with a qualified financial advisor before making any investment decisions.