Introduction
The comprehensive evaluation determines Tesla (TSLA) earnings and fair value assessment for 2025 through analysis of revenue projections, profitability metrics, stability measures and future growth estimates.
While establishing itself as a dominant force in the production of electric vehicles (EVs) and technological exploration, Tesla Inc. is a leading firm in both automotive production and technology innovation. Energy storage systems, solar technology, and self-driving technologies are just a few of the areas into which Tesla has diversified to build a sustainable business base. As a result of its consistent success in drawing in both investors and fans, Tesla’s financial performance continues to generate a great deal of interest.
This article explains revenue trends, corporate profitability, and overall operational wellness while thoroughly examining Tesla’s financial performance through a review of earnings data and fair value assessment. When evaluating Tesla’s market dominance and possible future direction, investors need to understand these factors. Market competition and shifting margins and production costs are constant challenges to the company’s rapid expansion.
To produce an unbiased evaluation of the company’s strengths and growth vulnerabilities, our research makes use of Tesla’s most recent financial documents and key performance metrics. This analysis is useful for investors, market analysts, and other observers who want to understand Tesla’s current position while examining its possible future course.
Key Takeaways
1. The projected growth rates of Tesla significantly affect its estimated fair value which spans from $112 to $172 per share.
2. The Q4 margin decreases signal potential obstacles for continued profitability achievement.
3. The company maintains financial stability for expansion because its strong balance sheet improves debt ratios.
Financial Metrics and Margins for Tesla
The 2024 financial overview of Tesla demonstrates robust revenue expansion through its profits struggle to remain stable. The company maintains healthy revenue growth due to its worldwide business expansion, increased vehicle sales numbers and rising energy segment income. The financial standing of Tesla becomes clearer through a detailed analysis involving profitability margins together with cash flow metrics and balance sheet health indicators.
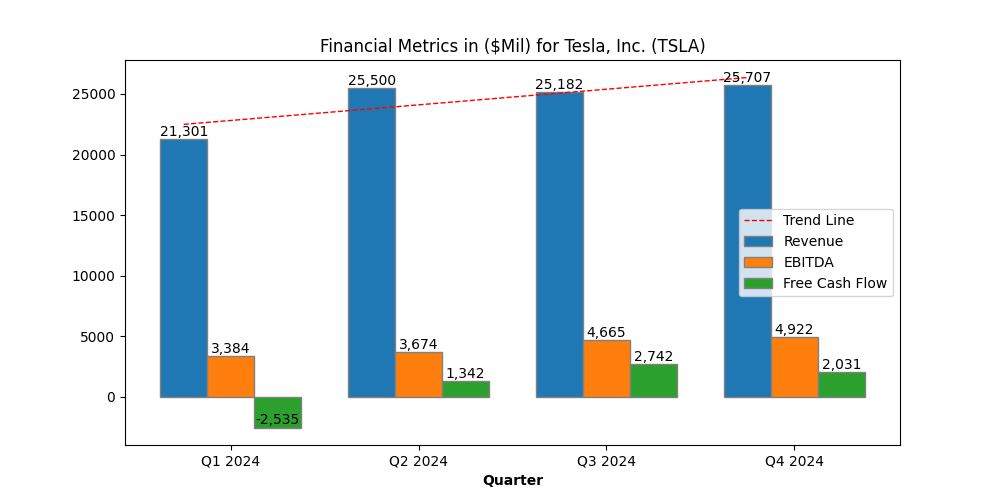
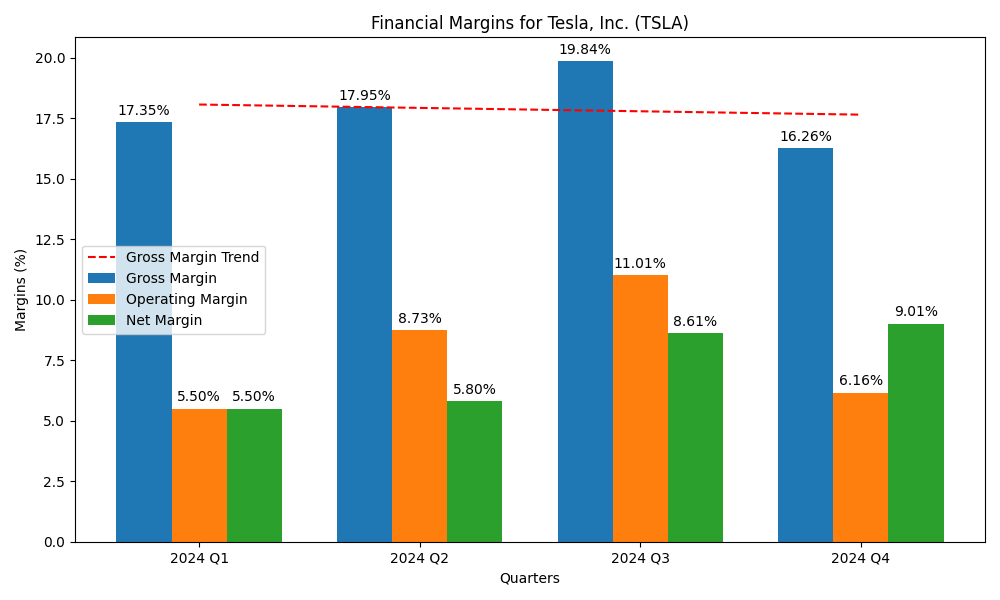
The company achieves strong revenue results from high demand across its automotive and energy product sectors. The Q4 gross profit margin showed a downward trend representing increase in COGS while the revenue showed marginal improvement over Q3. Tesla experiences declining gross margin which might stem from vehicle price reductions along with higher operational expenditure. The Q4 operating margin declined because Tesla invested more funds into research development along with factory expansions and research initiatives. The company shows signs of major investment in long-term growth which leads to decreased short-term profits. [1]
The bottom line expenses of Tesla improved slightly during Q4 while margins saw marginal decreases according to quarterly figures. The declining operating margin might create problems unless revenue growth exceeds increased operational costs. Investors need to watch Tesla’s strategies for handling both its expansion investments as well as its profitability management. For a focused breakdown of Tesla’s stock reaction to recent earnings volatility, read our Q3 earnings volatility analysis.
During the second and fourth quarters Tesla generated sustainable free cash flow which demonstrated its operational financial strength to support capital-intensive expenses. The positive FCF signal represents a promising development for Tesla since the company has typically experienced negative FCF when supporting Gigafactories construction and conducting research and product development. The enhanced FCF demonstrates that Tesla is becoming more financially stable which will allow it to support its expansion initiatives independently from outside funding sources.
Despite these changes in cash flow Tesla’s financial picture remains vulnerable to how well it produces vehicles and controls expenses alongside customer purchasing trends. Decreased future cash flow could force Tesla to evaluate its investment choices along with operational efficiency for maintaining financial stability. [3]
Assets, Liabilities, debt and Capital Ratios for Tesla
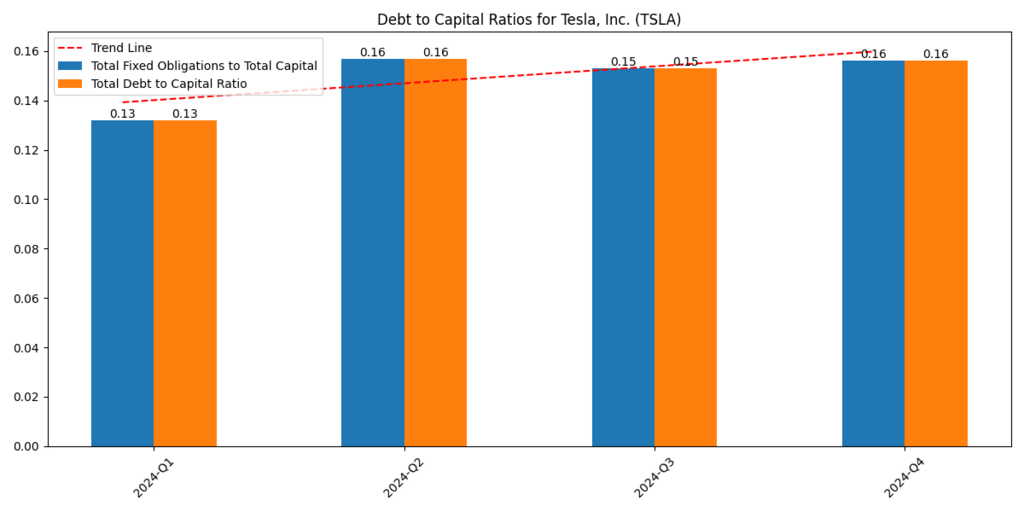
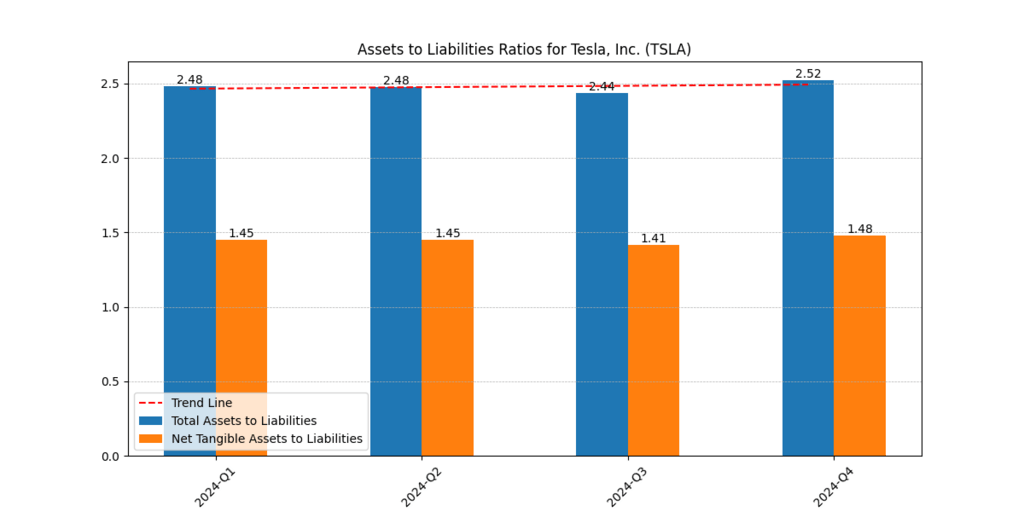
The assets at Tesla exceed its liabilities by an acceptable degree because of its favorable assets-to-liabilities ratio. Financial stability assessment depends significantly on Tesla’s ability to maintain excess assets that support operational operations and future investments. The slight decrease in Q4 ratio indicates Tesla accumulated more liabilities through debt financing together with higher operational costs. During Q4 Tesla demonstrated better control of its debt management which resulted in a stable debt-to-capital ratio. A lower debt-to-capital ratio indicates that operations run by Tesla rely minimally on debt funding, which enhances its long-term sustainability potential. Investors need to keep track of Tesla’s debt management approach particularly as the company develops new market interests and technological initiatives. [2]
PE, PB, PE, PB multiple and EPS for Tesla
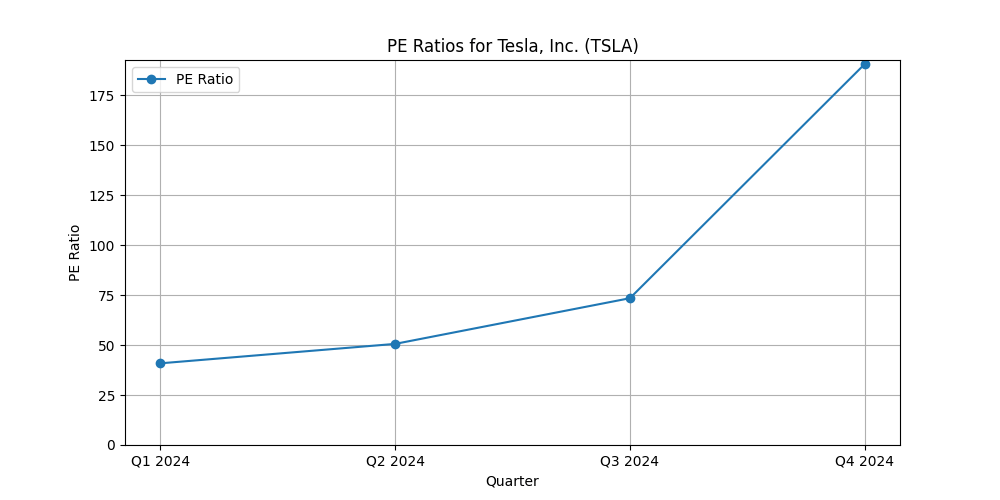
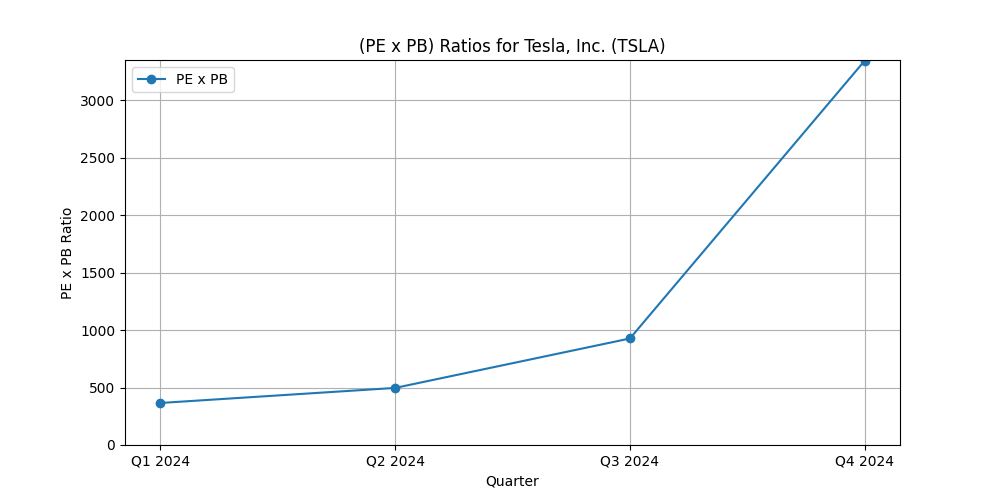
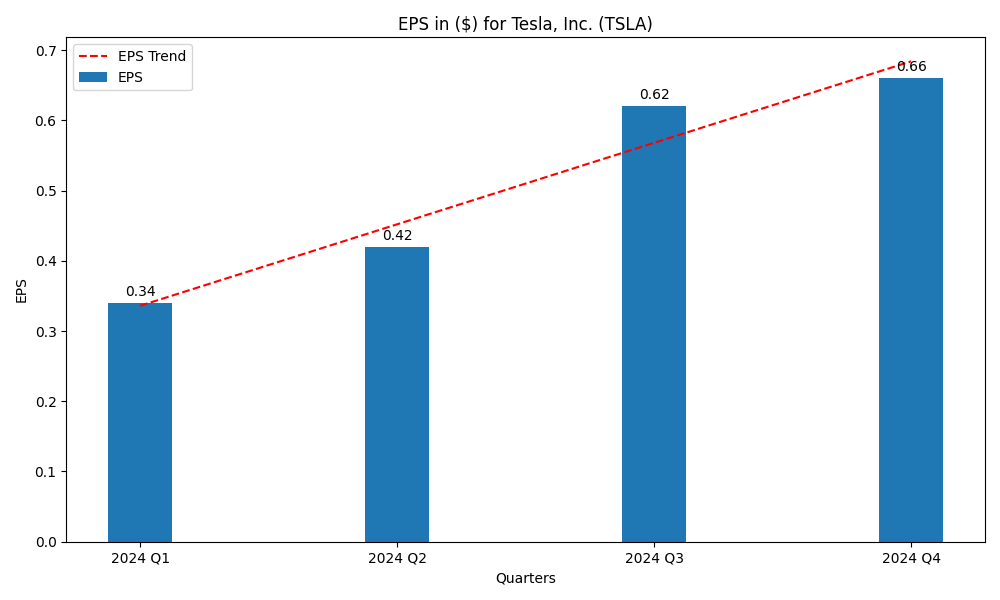
Earnings Per Share (EPS) at Tesla continued to rise across 2024 without being negatively impacted by margin challenges. Investors should take into account that the Q4 EPS of 0.66 GAAP and $0.73 NON-GAAP includes $695 million for their BTC holdings mark to market value, a subtraction of this income will reduce Tesla’s EPS to $0.51. The upward direction of EPS demonstrates better financial results to investors through increased sentiment about the company’s performance. Tesla stock assessment for fairness needs both Earnings Per Share evaluation and examination of Price-to-Earnings ratio and Price-to-Book ratio metrics. The Price to Earnings ratio evaluates Tesla stock value compared to its earnings to show the total investor investment potential per dollar earned by the company.
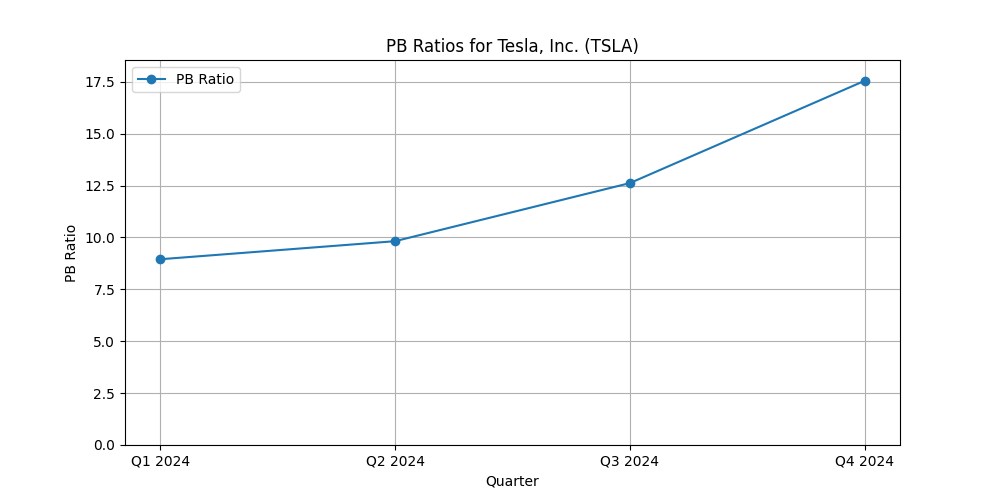
A high P/E ratio indicates investors expect future growth although it may signal that the stock trading above its true value. Investors use P/B ratio to evaluate Tesla’s market valuation against book value assets minus liabilities which determines if the stock exceeds its fundamental worth. The P/B ratio of Tesla appears higher due to its fast growth and capital-intensive business model that is massively valued by investors due to its high anticipated future earnings potential regardless of current accounting figures. The PE of 198 and the PB of 17.5 suggests extreme valuation of Tesla’s stock price. Investors who analyze Tesla earnings patterns together with fundamental ratios will make better investment choices. [4]
Fair Value Analysis
| Growth Scenario | Fair Value (per share) |
| High Growth | $172 |
| Medium Growth | $149 |
| Low Growth | $112 |
Various growth projections help evaluate Tesla stock’s fair market price. The high growth and medium growth and low growth projections enable us to establish Tesla’s fair value for each scenario per share.
During its total market expansion and production expansion and energy innovation phase Tesla is expected to reach a fair value of $172 per share. The company’s revenue will expand significantly while its profitability grows simultaneously because of international market penetration and autonomous driving innovations that maintain market leadership. The Medium Growth scenario which takes a realistic view of Tesla’s competitive business landscape has established a share value of $149. If you are interested in broader biggest US companies performance, you can find it here Magnificent 7 Stocks Performance in 2024.
According to the Medium Growth projection Tesla will preserve its industry leadership position through consistent growth at regular rates instead of high-speed expansion. Company growth potential faces limitations due to dangerous situations from competitors as well as regulatory issues and supply chain disturbances. The Low Growth projection presents Tesla stock worth at $112 because competitive agents combine with market saturation alongside regulatory obstacles. [2]
The Low Growth scenario reveals a pessimistic mindset because Tesla is projected to develop at a reduced rate which would prevent the company from reaching its full market potential. The expected growth trajectory heavily affects Tesla’s current market share value. Stockholders evaluating Tesla’s fair value must account for both present and upcoming risks together with potential opportunities due to past success but uncertain future potential. If you want a long-term strategic view beyond 2025 assumptions, see our detailed Tesla 2030 price outlook following Q2 2025 earnings, “The Road Ahead: A Deep Dive into Tesla Stock 2030 Price Prediction Post-Q2 2025 Earnings.“
Tesla’s Major Projects
| Project | Description |
| Gigafactories | Tesla’s manufacturing plants for electric vehicles and batteries, aiming for large-scale production. |
| Cybertruck | An all-electric, rugged pickup truck designed for both consumer and commercial markets. |
| Tesla Semi | An electric semi-truck designed to revolutionize freight transport with zero-emissions. |
| Full Self-Driving (FSD) | Tesla’s advanced autonomous driving system aiming to make vehicles fully self-driving. |
| Energy Storage Solutions | Battery storage systems like Powerwall and Powerpack for residential and commercial energy needs. |
| Solar Roof | Solar panels integrated into roof tiles for sustainable energy generation in homes. |
| Supercharger Network | Tesla’s network of high-speed charging stations to support its electric vehicle ecosystem. |
| Tesla AI | AI research for advancing autonomous driving and other artificial intelligence applications. |
For a broader analysis of how Tesla’s EV, AI, and energy businesses could reshape valuation through 2030, explore our Tesla 2030 forecast, “Tesla Stock Forecast 2030: Can TSLA Reach New Heights with EVs, AI & Energy Growth?“
Conclusion
Tesla accomplished robust financial results in fiscal year 2024 in energy market sector but vehicle production and especially deliveries decreased first time in more than a decade. Market competition and higher production costs create difficult challenges for the company as operating margin and gross margin performance in Q4 decline. Tesla’s high revenue figures during Q4 face significant challenges due to declining margins which make it hard to continue existing growth patterns unless the organization either resolves its cost structure problems or enhances its pricing capabilities.
Financial data shows Tesla has strong fiscal strength because its ample cash reserves allow effective debt management. Total net cash helps Tesla maintain stability during changing market dynamics as well as allow the company to pursue innovation development and expansion plans. We project Tesla’s theoretical worth will range from $112 to $172 per share based on our forecasted business growth outcomes.
The stock value of Tesla faces difficulties from external market pressures and intensified market competition in periods of limited market expansion but its leading market position and breakthrough innovations in growing markets will lift its enterprise worth. Investors need to track how profitable Tesla remains and how efficient its operations remain because these factors directly influence the company’s performance and stock price values between 2025 and future years. However, the present valuations do not justify the high stock price for Tesla.
Usama Ali
Usama Ali is the founder of Financial Beings and a self-taught investor who blends classic valuation study with insights from psychology. Inspired by works from Benjamin Graham, Aswath Damodaran, Stephen Penman, Daniel Kahneman, and Morgan Housel, he shares independent, data-driven research to help readers connect money, mind, and happiness.
Disclaimer
The content provided herein is for informational purposes only and should not be construed as financial, investment, or other professional advice. It does not constitute a recommendation or an offer to buy or sell any financial instruments. The company accepts no responsibility for any loss or damage incurred as a result of reliance on the information provided. We strongly encourage consulting with a qualified financial advisor before making any investment decisions.