
NVIDIA vs Broadcom in 2026 -Are they real competitors, and which stock provides more safety, higher intrinsic valuation growth and better projected returns?? Big data comparative analysis of AI leadership, risk, and market mispricing.
NVIDIA vs Broadcom Stock– What this Study Covers?
In 2026, artificial intelligence will continue to be the prevailing capital allocation theme in world markets. Cloud vendors are building AI centers, companies are adopting AI to core services and, governments are spending money on national AI infrastructure projects in order to stay at the technological cutting edge. This long cycle of investment has transformed the demand of semiconductors, networking architecture and enterprise software. Consequently, AI is not merely a technology trend anymore, it is an engine of profits expansion, leverage, and capital manageability within the technology industry.
To investors, it is no longer a question of Will AI grow? But rather one of NVIDIA vs Broadcom – which firm is in better position to win the long-term spending of AI while also addressing risk well? NVIDIA is a sign of focus on AI compute acceleration, i.e., its performance is highly dependent on data center demand cycles. On the contrary, Broadcom integrates semiconductor solutions with infrastructure software and provides a wider scope of exposure to several AI infrastructure layers. It is now all about growth sustainability, capital efficiency, balance sheet structure, and valuation sensitivity rather than headline revenue momentum.
Results Snapshot
Revenue Structure
Table 1: Revenue Breakdown Comparison
| Company | Segment | Revenue Share |
| NVIDIA | Data Center | 85.5% |
| NVIDIA | Gaming | 11.2% |
| NVIDIA | Other Segments Combined | 3.3% |
| Broadcom | Semiconductor Solutions | 57.7% |
| Broadcom | Infrastructure Software | 42.3% |
The revenues of NVIDIA are heavily skewed on Data Center. Broadcom also has a significant share of revenue that is divided between semiconductors and infrastructure software.
Capital Efficiency (RNOA)
NVIDIA exhibits swings to the extreme and high RNOA peaks in later years. Broadcom demonstrates a more stable growth in RNOA.
Balance Sheet Structure
The Net Operating Assets (NOA) of NVIDIA grow tremendously. The Operating Liabilities of Broadcom increase drastically in later years.
Valuation Sensitivity
The inherent values of both companies are greatly sensitive to long term growth variations of between 2 to 8 percent.
These are the four signals that define investment structure of nvidia vs broadcom in 2026.
Are Broadcom and NVIDIA Competitors in 2026?
Where Their AI Businesses Overlap
The two companies are at the core of AI infrastructure. According to Data Center as indicated in the filings of NVIDIA, Data Center is a core end market that is backed by compute and networking. Broadcom is in the field of Semiconductor Solutions and Infrastructure Software that provides connectivity, custom silicon, and enterprise cloud solutions.
They overlap in:
- AI data center expansion
- Hyperscaler infrastructure expenditure.
- High-performance networking environments
But NVIDIA is the main player in compute acceleration while Broadcom provides infrastructure components and enterprise software layers. In nvidia vs broadcom the rivalry is on share in AI capital allocation rather than the equivalent products.
How Their Revenue Models Fundamentally Differ
The high concentration of Data Center revenues of 85.5 percent indicates that NVIDIA has a strong dependence on AI capex cycles. This concentration enhances positivity and negativity.
Broadcom also introduces recurring enterprise exposure, with infrastructure software accounting for 42.3%. Infrastructure software also has hybrid cloud, security, and enterprise networking solutions. Such diversification reduces cyclicality risk.
Therefore, NVIDIA is focused AI acceleration; Broadcom is diversified AI infrastructure, when looking at NVIDIA and Broadcom comparison.
Semiconductors vs Infrastructure: Competing or Complementary?
They are in practice generally complementary. NVIDIA GPUs work within data centers which need Broadcom networking and infrastructure software.
But on an investment perspective, the capital into AI infrastructure might affect a shift towards one layer compared to another. NVIDIA would benefit more if an AI compute budget prevails. If the business companies focus on unified infrastructural platforms, Broadcom can acquire a wider share of the wallet.
This is the structural difference which is at the core of the thesis of nvidia vs broadcom.
Business Model Breakdown: NVIDIA vs Broadcom
NVIDIA’s GPU and AI Acceleration Ecosystem
The strength of NVIDIA is in integration of ecosystem. There are several end markets identified, yet Data Center dominance is exhibited. Yahoo Finance also offers solutions that NVIDIA provides based on AI acceleration, networking, and computing platforms.
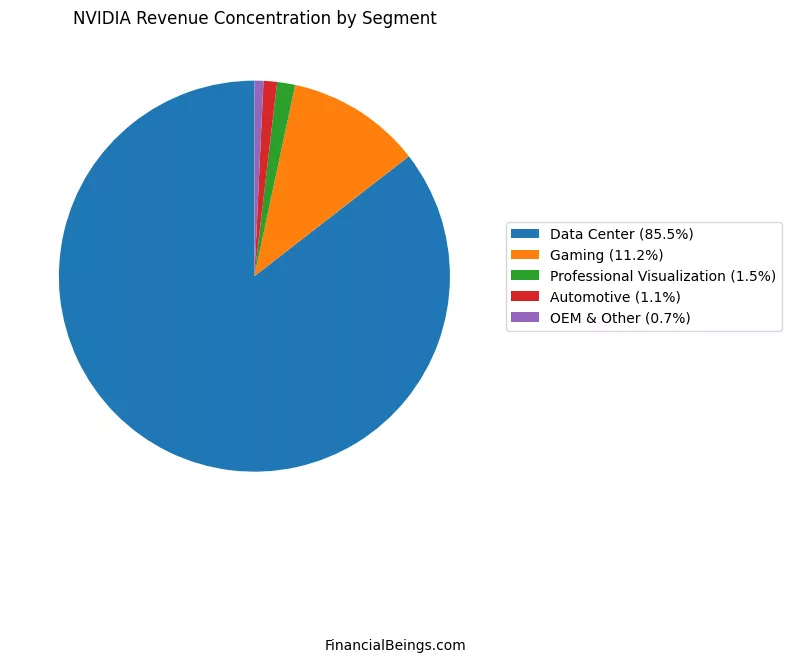
Figure 1. NVIDIA Revenue Breakdown by Segment (FY2025)
The outcome of 85.5% Data centre concentration is great:
• High operating leverage
• Higher economic earnings volatility.
• Strong AI cycle exposure
• compounding growth potential.
Revenue and operating efficiency of NVIDIA grow quickly as AI spending is growing. Nevertheless, the concentration is the risk factor when hyperscalers budgets become normal.
In the nvidia vs Broadcom argument, the high beta AI vehicle is NVIDIA.
Broadcom’s Infrastructure Software and Custom Silicon Strategy
Broadcom is a company that works in the fields of Semiconductor Solutions and Infrastructure Software. Its business model combines:
- Hyperscaler custom silicon.
- Networking connectivity
Enterprise infrastructural software.
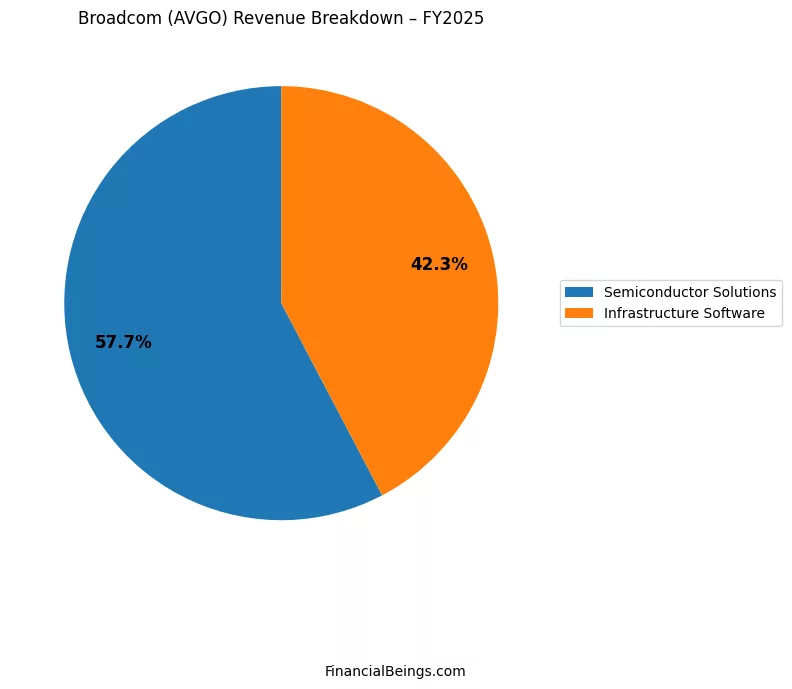
Figure 2. Broadcom Revenue Breakdown by Segment (FY2025)
The 42.3% share of Infrastructure Software that can bee seen by the revenue distribution diagram above is a source of stability and frequent exposure. Software revenues are sometimes subject to other risk dynamics than hardware cycles.
The model of Broadcom decreases the dependency on one AI income generator. In nvidia vs broadcom, Structural diversification is offered by Broadcom.
Revenue Diversification and Customer Concentration Risk
The revenue concentration at NVIDIA makes it more reliant on AI hyperscaler demand.
The dual-segment organization spreads risk at Broadcom:
- Semiconductor customers
- Clients on the enterprise software.
- Cloud infrastructure implementations.
Diversification does not remove risk, but makes volatility smooth. This difference can be significant to portfolio-level investors.
Revenue Growth and Profitability Trends (2022–2026)
AI-Driven Growth Acceleration
NOA expansion is a proxy of operating scale.
Table 2: Structural Balance Sheet Trends
| Metric | NVIDIA | Broadcom |
| NOA Growth | Strong upward trend | Moderate |
| Operating Liabilities | Steady increase | Sharp late increase |
| Structural Signal | Asset-driven expansion | Liability-supported scaling |
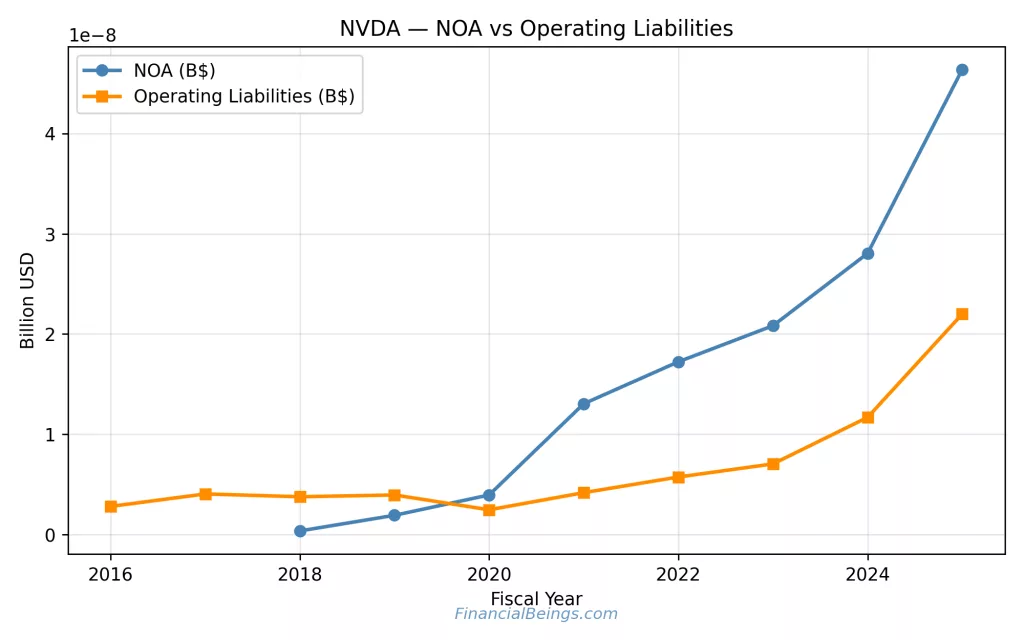
Figure 3. NVIDIA Net Operating Assets vs Operating Liabilities (2016–2025)
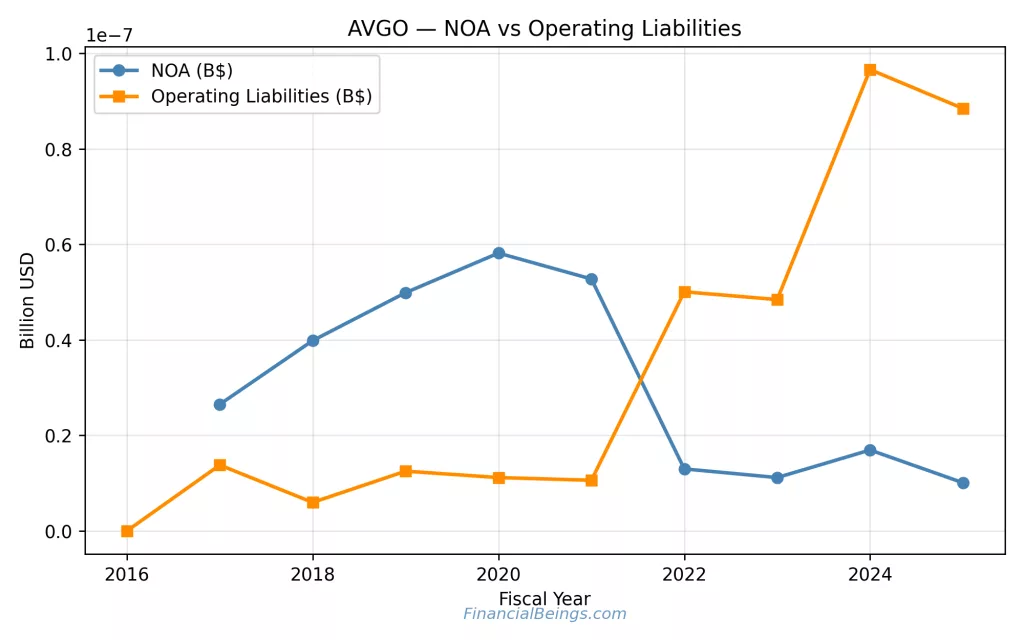
Figure 4. Broadcom Net Operating Assets vs Operating Liabilities (2016–2025)
- The rising Net Operating Assets (NOA) in the graphs reflect that NVIDIA is reinvesting aggressively by expanding its operating assets. This indicates the addition of assets necessary to support the high capital expenditures by several companies around the world.
- Broadcom on the other hand in the later years shows that the company has shifted its strategy operating more with liabilities than operating assets since late 2020.
Operating Margins and Capital Efficiency
RNOA will give a less distorted measure of profitability in comparison with capital invested, rather than quoting margins.
Return on Net Operating Assets (RNOA) Comparison
Table 3: RNOA Pattern Analysis
| Company | RNOA Pattern | Implication |
| NVIDIA | Extreme highs and volatility | Powerful leverage, cyclical |
| Broadcom | Gradual improvement | Stable operational discipline |
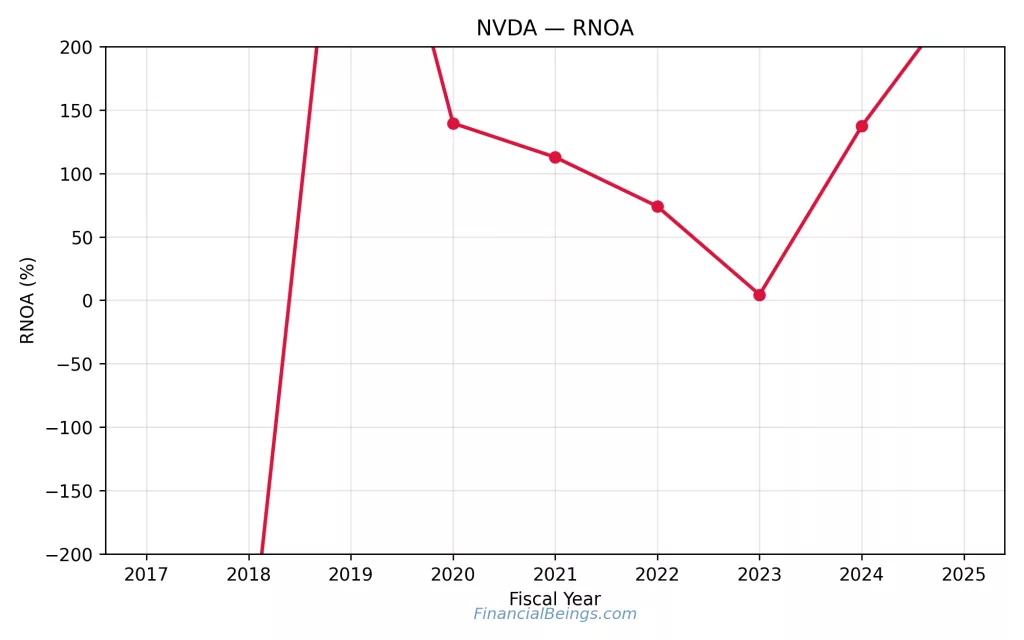
Figure 5. NVIDIA Return on Net Operating Assets (RNOA) Trend (2017–2025)
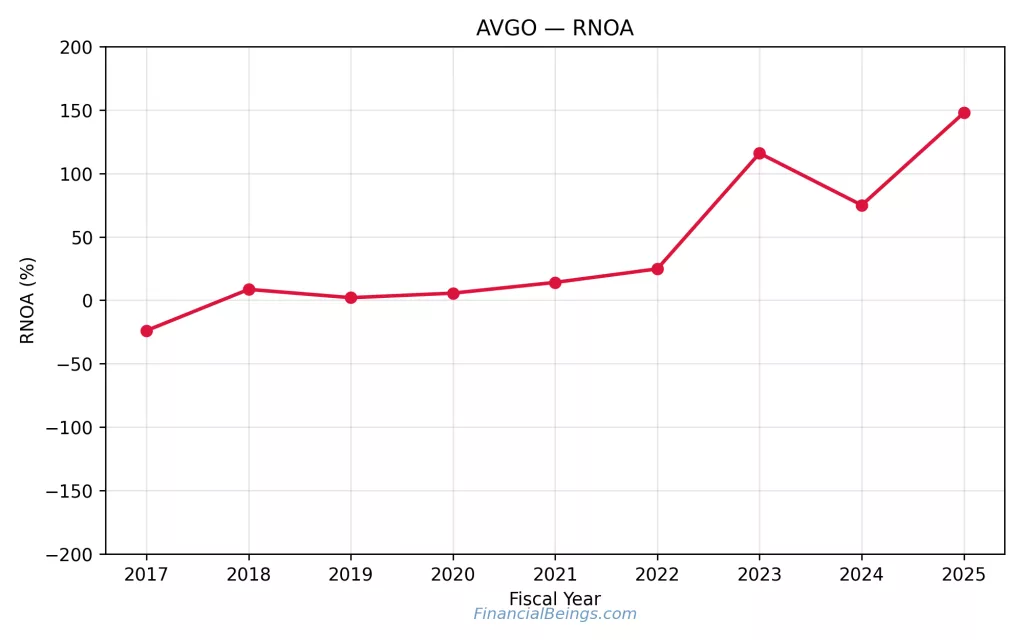
Figure 6. Broadcom Return on Net Operating Assets (RNOA) Trend (2017–2025).
The RNOA of NVIDIA displays a dramatic growth in the later years which implies that NVIDIA is a highly profitable company during current AI boom.
Broadcom has a steady increase in RNOA which represents steady capital efficiency gains.
NVIDIA has greater potential explosive profitability, and Broadcom has more certain compounding.
NVIDIA vs Broadcom Stock: Valuation Analysis (Interactive Chart 2026)
Growth Sensitivity: 2%–8%
Growth sensitivity changes intrinsic value significantly with various assumptions of growth over the long run. For in depth long-term valuation analysis beyond 2030 for NVDA, where we dissect the market hype and the true value to make it clearer for our readers is here.
Table 4: Growth Sensitivity Summary
| Growth Scenario | NVIDIA | Broadcom |
| 2–3% | Low intrinsic value | Low intrinsic value |
| 5–6% | Moderate intrinsic value coverage | Moderate intrinsic value coverage |
| 7–8% | Intrinsic value ≈ Market price | Intrinsic value ≈ Market price |
| Growth (%) | NVDA IV ($B) | NVDA P/Share | NVDA V/P % | AVGO IV ($B) | AVGO P/Share | AVGO V/P % | Δ V/P |
|---|
Figure 7. Intrinsic Value Sensitivity to Long-Term Growth Assumptions (0%–8%)
Both companies need to experience significantly higher growth (7%-8%) in order to enjoy current market valuation.
Intrinsic Value vs Market Price
This indicates existing market price reference lines converges to intrinsic value bands. Interpretation:
- Should market value coincide with high-growth assumptions beyond 8%, the stock price rises above current market price.
- Upside compression occurs in the event that growth returns to normal in the range of 2%-5%.
Therefore, the valuation risk for NVIDIA and Broadcom is growth-related.
Market-Implied Growth
The sensitivity of investors to the durability of AI demand is often the focus of financial coverage (Financial Times). Even high earnings would be responded, when the expectations are already high.
Both stocks seem to incorporate high AI continuation factors in pricing. The market is implying very high growths for NVDA and AVGO that are unsustainable in the long run. What did we say about NVDA after its FY-Q3 2026 results and what the market was pricing in NVDA’s price at that point in time? The details will help you understand how the market is expecting an unsustainable growth rate for NVDA.
Expected Returns: Which Stock Offers the Better Risk-Reward?
Comparing NVIDIA and Broadcom, expected return will be very sensitive to the sensitivity of each company valuation to the long-term AI growth assumption. This would result in two different risk-reward profiles, one where it is classified into concentrated AI acceleration (NVIDIA) and the other is where it is risk-rewarded by diversified infrastructure exposure (Broadcom).
Price Sensitivity Across Growth Assumptions
The intrinsic value curve of NVIDIA is more apparent in the growth sensitivity. This implies that small growth assumptions in the long term generate large growth estimates of intrinsic value. The convexity of that forms a strong upside if AI spending is robust over a series of years.
Broadcom has a curve, which is not as sharp as responsive to growth. This suggests:
- Less extreme increase in upside acceleration.
- Growth assumption at slower growth with lower extreme downside.
The Nvidia vs broadcom structure is that NVIDIA will provide the better growth torque with Broadcom providing the more consistent growth.
Value / Price Implications
According to positioning:
- Both firms are valued in the long-term AI growth.
- Both stocks do not seem to be highly discounted in low-growth cases.
This implies that the ability to raise returns in future will not be done by mere multiple expansion. Rather, returns will be based on surpassing, meeting or underperforming actual AI infrastructure growth around the world in relation to embedded expectations.
In NVIDIA vs Broadcom valuation, risk is symmetrical, growth realisation needs to be durable.
Five-Year Expected Return Outlook
In case the investment into AI infrastructure remains rapid:
- NVIDIA offers return in the range between 7.40% to 10.40% if the growth stays between 5%-8%.
- Broadcom’s expected return between 5%-8% growth is in the range of 6% to 9% that is lower than NVIDIA.
Provided that AI expenditures stabilize at moderate amounts:
- The sensitivity of earnings of NVIDIA may cause compression of valuation.
- The diversified revenue portfolio of Broadcom can help in mitigating volatility.
In the five-year horizon, NVIDIA has the greater upside, whereas Broadcom produces lower returns.
Balance Sheet Strength and Capital Allocation
When the rates of growth stabilize, capital allocation strategy comes in. The scale of both companies is different, which is reflected in the Operating Liabilities as well as the NOA.
Debt, Buybacks, and Cash Position
According to this:
- NVIDIA increases Net Operating Assets in an aggressive form, which is indicative of investment in operating assets.
- In later years, Broadcom is experiencing a marked increase in Operating Liabilities, which reflects opposite pattern of structural funding.
These differences suggest:
- NVIDIA has a focus on the growth of the assets.
- Broadcom is using operating leverage in an aggressive manner.
Acquisition Strategy and Strategic Moats
The competitive advantages of both companies are of a durable nature but their moats are different in nature.
NVIDIA’s moat:
- Integration of platform ecosystem.
- Far-reaching expertise in AI compute acceleration.
- Grower and high-powered alignment of developers.
Broadcom’s moat:
- Broadbanding of infrastructure at semiconductor and software layers.
- Enterprise connection facilities.
- Differentiation in AI infrastructure components.
Both companies summaries in Yahoo Finance firms confirm that they operate at a variety of AI-relevant verticals (finance, n.d). The moat of NVIDIA is depth based; the moat of Broadcom is breadth based.
Risks Investors Should Not Ignore in 2026
The structural risks are present even to these AI companies. The knowledge of these risks brings about the risk-reward tradeoff.
AI Demand Normalization Risk
The high concentration of NVIDIA Data Center revenue with 85.5% also exposes the company to hyperscaler budget changes. Growth might start to tame in case AI capital expenditure decelerates.
The 42.3% Infrastructure Software revenue of Broadcom is somewhat insulating, since the adoption of enterprise software does not change in the same way as hardware cycles.
In nvidia vs broadcom, therefore, NVIDIA has more single-engine exposure.
Customer Concentration and Cyclicality
Both companies depend on high enterprise and cloud clients. However:
- NVIDIA is closer to AI training and compute demand cycles.
- Broadcom enjoys the wider adoption of infrastructure, such as networking and integration of software.
This variation can affect earnings volatility in the economic cycles.
Regulatory and Geopolitical Exposure
The supply chains in semiconductor are still subject to exportation, trade polices and geopolitical strains. These structural uncertainties are often addressed when it comes to revenue coverage.
NVIDIA and Broadcom are global companies, and hence are vulnerable to the change in policy and the global trade.
Portfolio Fit: Growth, Balanced, or Conservative Allocation?
It is portfolio strategy that is split into the decision between NVIDIA vs Broadcom.
For High-Growth Investors
NVIDIA provides the greatest AI potential. It has a high-intensity exposure, which can produce disproportionate returns if AI demand keeps growing at a high rate. Nevertheless, volatility will tend to be high.
For Risk-Controlled Portfolios
Risk-controlled portfolios are to be contained by various risk factors for the allocation of capital.
Broadcom offers:
- Revenue diversification.
- Software exposure to infrastructure.
- Slower capital efficiency increment.
It can be appropriate for investors who want to have AI exposure while having less variability in earnings.
For Long-Term AI Exposure
Single-layer risk is minimized in AI infrastructure via a joint provision. The ownership of both companies is a diversification between the compute acceleration and infrastructure software layers.
Final Verdict: NVIDIA vs Broadcom Stock in 2026
The case nvidia vs broadcom does not concern the power of each company – they are both giants in AI infrastructure.
It refers to risk tolerance and growth expectations.
- NVIDIA = focused AI acceleration engine, which has a greater upside and greater volatility.
- Broadcom = diversified AI infrastructure compounder with lower returns for investors.
When AI growth continues to be significantly higher than GDP over a period of years, then NVIDIA does better but Broadcom offers better diversification, however lower returns. Investors should take into account that the current market pricing for both the stocks leave less to no margin of safety. Hence, caution is required, if, in case we see AI boom downturn.
All calculations and valuation estimates are FinancialBeings’ own, based on data sourced from SEC filings of NVDA (10K and 10Q) and AVGO (10K and 10Q), use or reproduction before prior approval is prohibited.
Usama Ali
Usama Ali is the founder of Financial Beings and a self-taught investor who blends classic valuation study with insights from psychology. Inspired by works from Benjamin Graham, Aswath Damodaran, Stephen Penman, Daniel Kahneman, and Morgan Housel, he shares independent, data-driven research to help readers connect money, mind, and happiness.
Disclaimer
The content provided herein is for informational purposes only and should not be construed as financial, investment, or other professional advice. It does not constitute a recommendation or an offer to buy or sell any financial instruments. The company accepts no responsibility for any loss or damage incurred as a result of reliance on the information provided. We strongly encourage consulting with a qualified financial advisor before making any investment decisions.