
Executive Summary
Nvidia stock prediction 2030 after Q2 2026 earnings: The complete financial profile analysis as well as growth scenerios. Nvidia is a famous name in the field of AI infrastructure, high-performance computing, and accelerated innovation. Since the company reported its Q2 2026 results, the investment community has updated long-term models, focusing on valuation and sustainable growth. Based on historical fundamentals and forward-looking valuation metrics, we have increased our target price from $142 to $203, estimating a CAGR of 7.5% through 2030.
At the core of this choice is Nvidia Stock Forecast 2030, a scenario-driven valuation that combines Value-Added Earnings (VAE), return on equity (ROE), and the growth rate of equity earnings. The article provides a comprehensive review of Nvidia’s past (1993–2019), present (2021–2026), and future (2027–2030) periods. It incorporates year-end prices and shareholder equity from SEC 10-K filings for the years 2021 to 2025, as well as for three possible growth rates (7%, 7.5%, and 8%).
Nvidia is no longer just a semiconductor company. It’s a building block for the AI revolution. There are still short-term risks valuation stretch, competition, geopolitics but the long-term upside still looks compelling. For disciplined, long-term horizon investors, Nvidia remains a buy.
Investment Thesis
Four interconnected arguments can be used to summarize Nvidia’s investment thesis:
Technological Dominance
The CUDA platform from Nvidia produced a long-lasting ecosystem advantage. In contrast to conventional chipmakers, Nvidia is a leader in both software platforms and hardware sales. Pricing power and sticky demand are guaranteed by this dual positioning (Damodaran, 2023).
Balance Sheet Growth
Nvidia’s ability to reinvest while preserving liquidity was strengthened by the increase in shareholder equity from 2021 to 2025, which went from $28.8 billion to $78.5 billion (NVIDIA Corporation, 2025).
Superior Margins
Nvidia consistently maintains operating margins of over 60% and gross margins above 70%, far outperforming its competitors, AMD (~48%) and Intel (~45%). Such profitability is a reflection of both pricing power and efficiency.
Behavioral Finance Psychology
FOMO (fear of missing out) is reflected in the actions of investors toward Nvidia. Bullish sentiment is reinforced by anchoring bias on Nvidia’s historical exponential growth, and herding encourages inflows even at premium values (Barberis & Thaler, 2003).
These factors taken together support an increase in the Nvidia stock prediction for 2030. By 2030, our base case predicts $203 per share, with upside potential if bullish assumptions are maintained.
Nvidia’s Journey: Past, Present, Future
Past (1993–2019): From Gaming to Compute
Nvidia, founded in 1993, initially focused on graphics for the gaming industry. Its GeForce series led the consumer GPU market. The introduction of CUDA in 2006 turned Nvidia from a gaming to a computational powerhouse, adding more workloads (scientific, enterprise, AI) to GPUs. By 2010, Nvidia was recast as a data computing company.
Present (2021–2026): AI Infrastructure Backbone
From 2021-25, Nvidia’s book value almost tripled, reflecting solid retained earnings and reinvestment into strategic growth areas. This journey demonstrates Nvidia’s repositioning from a cyclical chipmaker to a structural underpinning of the global A.I. economy.
Table 1. Shareholder Equity and Year-End Stock Prices (2021–2025)
| Year | Shareholder Equity ($Bn) | Stock Price (Year-End, $) |
| 2021 | 28.8 | 29.41 |
| 2022 | 33.6 | 14.61 |
| 2023 | 42.9 | 49.52 |
| 2024 | 58.5 | 134.29 |
| 2025 | 78.5 | 171.66 (Current Price) |
Two key dynamics are evident in this table:
- Balance sheet expansion: The Increase in equity from $28.8B → $78.5 $78.5 $78.5B enhances Nvidia’s financial flexibility.
- Investor psychology: Despite the fundamentals, Nvidia momentarily traded in 2022 at $146 (driven by macro fears and herding), only for it to increase as AI adoption sped up in 2023 – 2025.
Nvidia strengthened its lead in AI infrastructure by Q2 2026:
- Revenue: $46.7B, considerably higher than $35B in late 2024.
- EBITDA: $31.9B, reflecting operating leverage.
- Free Cash Flow: $13.5B, compared to $22.6B in Q1 2025, because it is a cycle investment-heavy.
- Margins: Gross ~72–75%; Operating ~60%; Net ~56% — one of the leadership positions in global tech.
In other words, the 2021–2026 period is the time during which Nvidia transitioned from being a leader in GPUs to becoming the foundation for AI and cloud computing. Nvidia is no longer a cyclical semiconductor company; it’s now regarded by investors as a core infrastructure provider, in the same way that Microsoft is seen as a core infrastructure player in software.
Future (2027–2030): Beyond Semiconductors
Nvidia is positioning itself to extend well beyond semiconductors in the long term, into the ecosystems that form the foundation of the AI-driven economy.
Blackwell & Rubin Architectures
- These are Nvidia’s Succeeding Gen GPU Architectures, Smashing the H100 and A100 in Performance.
- They serve to solidify Nvidia’s position as the “arms dealer” for AI computing, so that hyperscalers (Amazon, Microsoft, Google) can’t operate without Nvidia.
Omniverse Expansion
- Omniverse’s purpose is to build industrial digital twins, virtual duplicates of factories, logistics networks, and even entire cities.
- It may be as big as or bigger than gaming, as businesses digitize to reduce costs, predict maintenance, and make their operations more sustainable.
Automotive AI Chips
- The Mercedes and Volvo prototypes are already using Nvidia’s DRIVE platform.
- By 2030, an independent car model might represent a multi-billion-dollar revenue opportunity, and Nvidia could be a key resource provider to mobility.
AI PCs and Robotics
- With AI being increasingly pushed to the edge, Nvidia’s chips are likely also to support a new breed of AI-capable personal computers and service robots.
- This spreads the revenue beyond data centers to consumer and enterprise devices.
Together, these projects imply that in 2030, Nvidia will not be “semiconductors alone.” Instead, it will be known as an AI infrastructure conglomerate that spans industries ranging from cloud computing and the automotive sector to healthcare, robotics, and industrial automation.
That vision is the foundation of the Nvidia stock Price Prediction 2030: a company that can support a 7-8% long-term CAGR, leading to $203-$259, driven by structural tailwinds in AI adoption.
Financial Performance and Valuation
The financial profile of Nvidia is both unusual and complicated. On one hand, it prints far better margins/returns than its comparable cohorts; on the other hand, its stock price depends on achieving hyper-growth many years into the future, for which you’ll want to pay a multiple that discounted cash flow (DCF) models can justify. This section dismantles Nvidia’s key performance pillars:
Balance Sheet Strength
Uploaded graph: Assets vs Liabilities. Nvidia’s assets exceed liabilities by over 3.0x in 2024–2026. Net assets tangible also exceeded 2.0x liabilities.
This balance sheet strength ensures that Nvidia can take missteps in reinvestment, face political headwinds, or experience cyclical downturns without significant risk to its long-term health.
Psychologically, investors are anchored to this health as a reason to pay rich multiples.
BS growth is the primary driver of credibility for long-term growth assumptions.
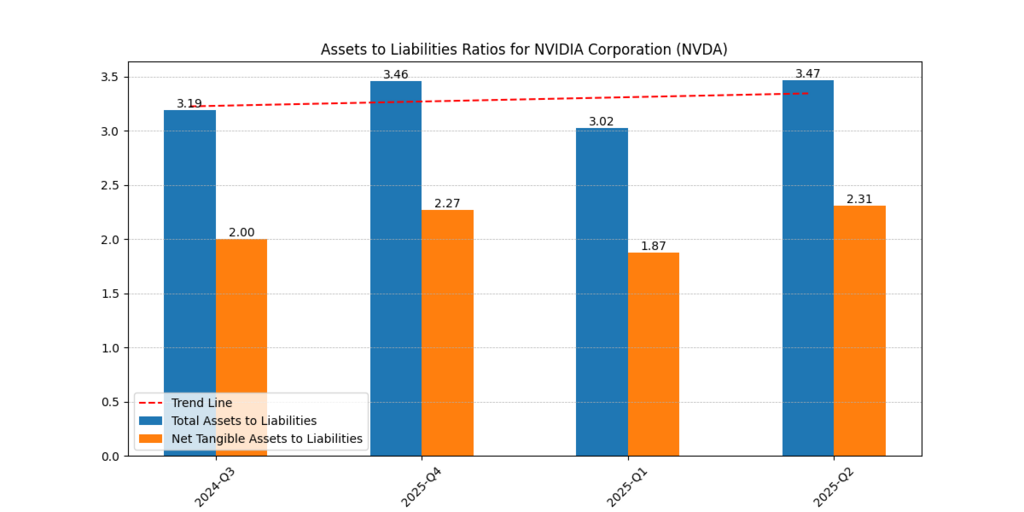
Figure 1: Nvidia’s total assets consistently outpace total liabilities (2024–2026), with ratios above 3.0x, highlighting strong solvency and liquidity.
Cash Flow Trends
The Cash Flow to Expenditures ratio shows a drastic decrease from 21.6x at 2024-Q3 to 8.1x at 2025-Q2.
- This is a massive reinvestment in the form of spending on data center capacity, R&D, future architectures, etc. (Blackwell, Rubin).
- Although free cash flow decreased from 22.6B (Q1 25) to 13.5B (Q2 26), it shouldn’t be interpreted as a weakness. Instead, it’s an indicator of Nvidia’s long-term capital deployment strategy.
- Behavioral finance point: Short-term investors go risk off on falling FCF, and long-term holders consider it value-creating re-investment.
The volatility of its liquidity is planned, strategic scaling.
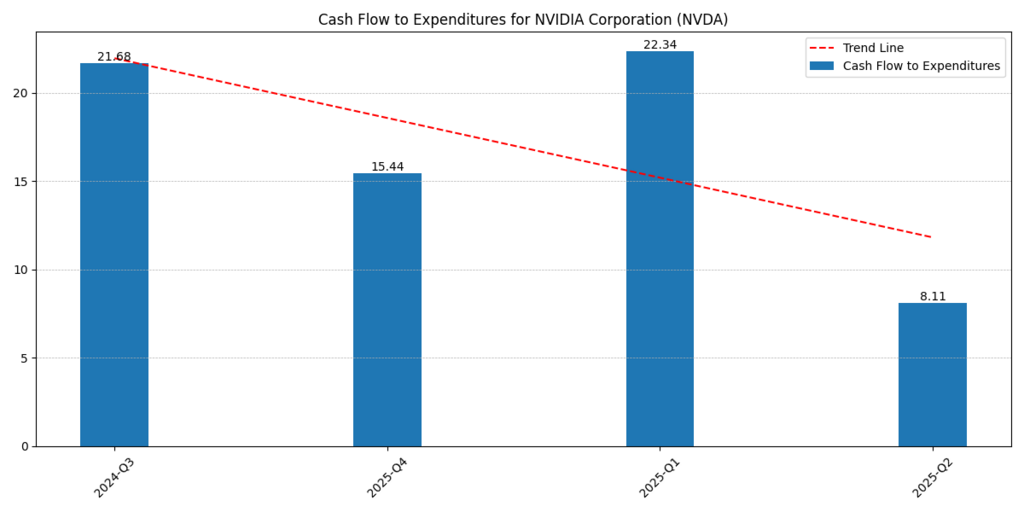
Figure 2: NVIDIA’s cash flow-to-expenditure ratio decreased from 21.6x in 2024 to 8.1x in 2025-Q2, indicating a strong commitment to R&D and infrastructure outlays.
Debt Profile
The Debt Ratios chart below confirms Nvidia’s conservative leverage:
- Debt-to-EBITDA: ~0.4x.
- Debt-to-Cash Flow: ~0.6x.
That’s because Nvidia has funded growth with internal cash flow, not through aggressive borrowing.
- This alleviates the fear of bankruptcy (something familiar when holding high-growth tech stocks) for investors.
- Modest debt levels please both the growth and risk-averse segments of the investment community.
- Nvidia’s growth does not rely on debt, so the $203 stock price is a credible one.
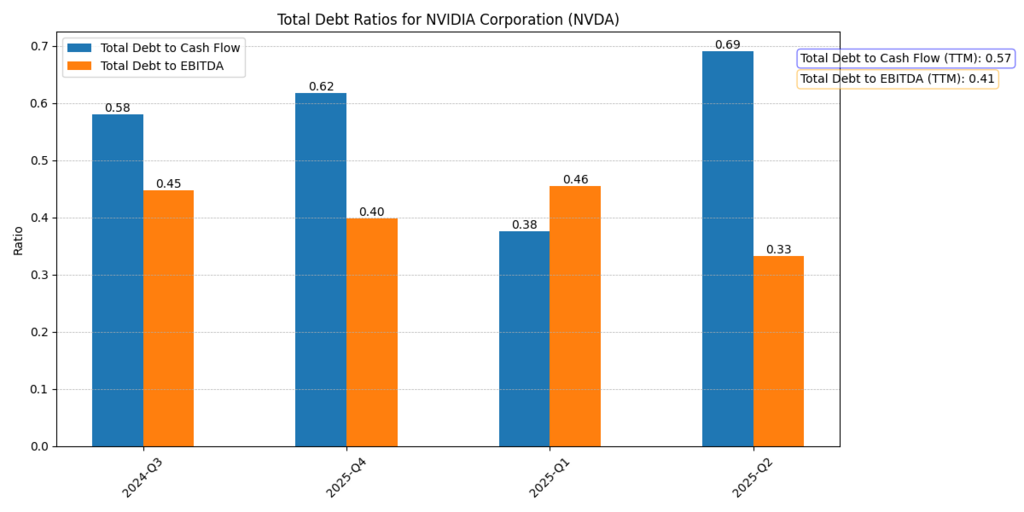
Figure 3: Nvidia holds low levels of leverage – Debt-to-EBITDA is around 0.4x and Debt-to-Cash Flow is below 0.7x – and financial risk is on the low side.
Margins
The Margins chart highlights Nvidia’s industry-leading profitability:
- Gross Margin: 72–75%.
- Operating Margin: 49–62%.
- Net Margin: 42–56%.
Even by peer standards, such as AMD (GM ~48%) and Intel (GM ~45%), Nvidia lags at about 20–25 percentage points behind.
This margin advantage is partly due to Nvidia’s pricing power resulting from CUDA lock-in.
Investors see those margins as evidence that Nvidia is not a commoditized chipmaker, but rather a tech monopoly that owns AI acceleration.
Margins lend credence to Nvidia’s status as a “premium stock.”
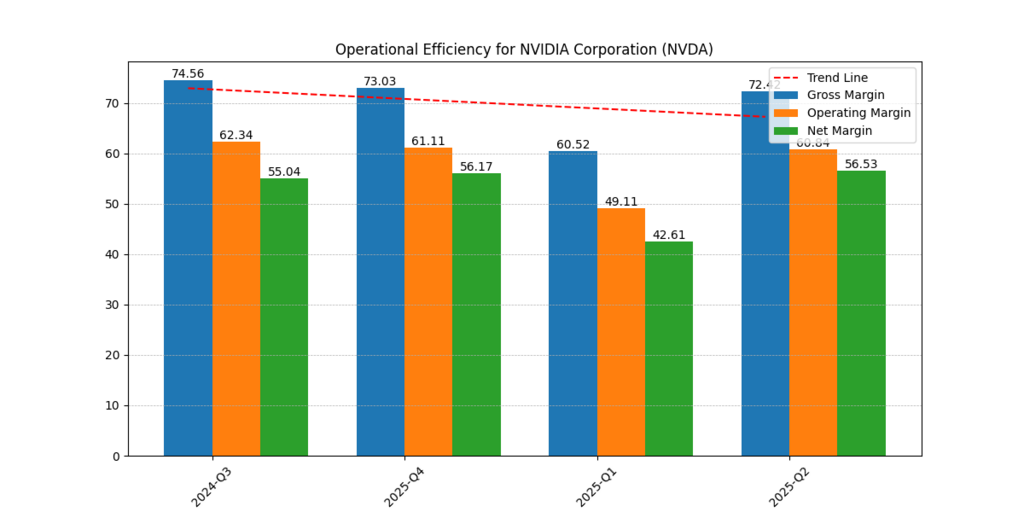
Figure 4: Nvidia’s margins are arguably the best in class. Margin performance, specifically, all of 2024-2026, of gross margins 72–75%, operating margins 60%, and net margins above 50%.
Growth Metrics
The Revenue, EBITDA, and Free Cash Flow chart indicates:
- Revenue: $35B (2024-Q3) → $46.7B (2025-Q2).
- EBITDA: $22.8B → $31.9B.
- FCF: reached a high of $22.6B, reduced to $13.5B from reinvestment.
This duality, characterized by explosive top-line growth but volatile cash flow, speaks to Nvidia’s challenge: balancing investor patience with near-term disappointment.
Growth is healthy, but investors will have to endure FCF volatility.
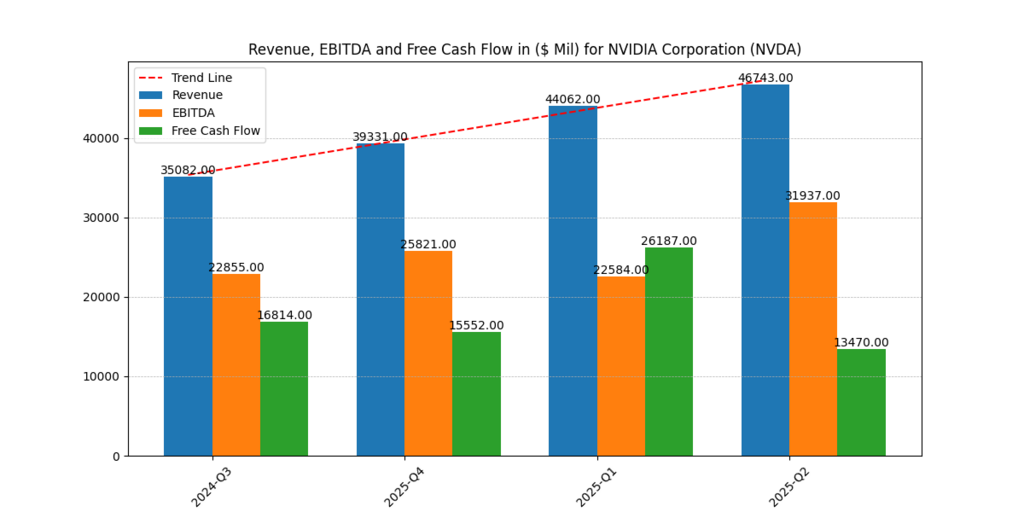
Figure 5: EBITDA increased to $31.9B, while revenue increased from $35B (2024-Q3) to $46.7B (2025-Q2). Reinvestment cycles led to a decline in free cash flow to $13.5 billion.
Returns on Capital
The ROE & ROTC graph shows Nvidia’s efficiency:
- ROE (TTM): 105.9%.
- ROTC (TTM): 109.2%.
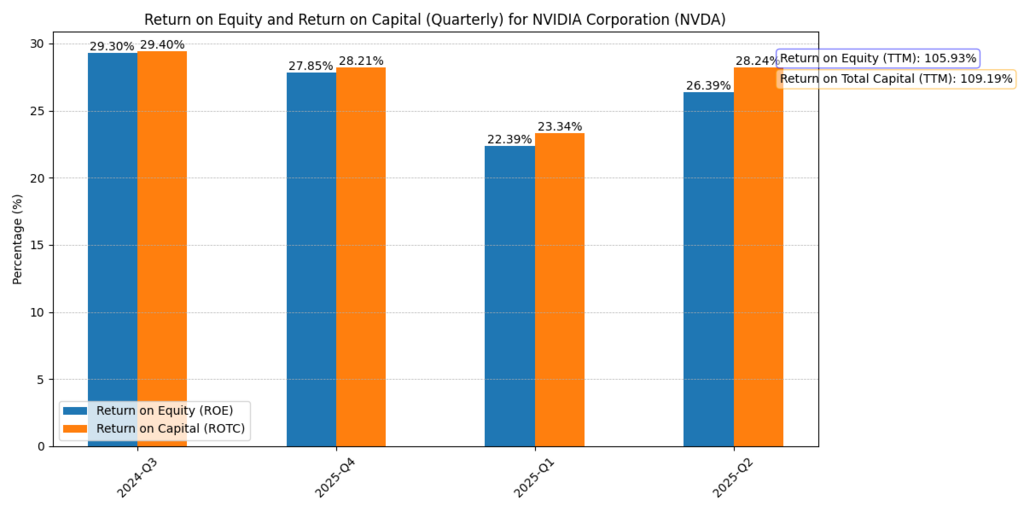
Figure 6: Nvidia achieved more than a 100% return on equity (ROE) and return on total capital (ROTC) in 2025–2026, revealing extraordinary capital efficiency and profitability.
- These are outrageous numbers, indicating nearly no required dollar of capital per dollar of income produced.
- Investors’ psychological anchors on these sky-high returns lead them to use overly optimistic projections for future returns.
- Making history, however, are those super-sized returns that often end up reverting to the mean, as disillusionment becomes the trigger for cycles.
ROE >100% is a rarity, and sustaining it through 2030 is an aggressive projection.
Valuation Multiples: Scenario Analysis
Table 2. Nvidia Valuation Estimates (2025–2026)
| Metric | 2025 | 2026 |
| Value-Added Earnings ($) | 4.17 | 5.89 |
| ROE (%) | 139 | 154 |
| No-Growth Price/Share ($) | 47.15 | – |
| Growth Price/Share (7% CAGR) | 167.09 | – |
| Growth Price/Share (7.5% CAGR) | 203.42 | – |
| Growth Price/Share (8% CAGR) | 259.76 | – |
| Value-Adding Growth Rate (%) | – | 8.24 |
| Market Implied Growth Rate (%) | – | 6.4 |
- No-growth value ($47.15) illustrates how low Nvidia could go in a world where AI hype fades.
- Scenario-based growth values ($167–$259) are sensitive to CAGR assumptions.
- Base Case (CAGR7.5%, $203.42) is the basis of our price target for Nvidia stock Prediction 2030. based on current operational pergormance.
Nvidia also boasts best-in-class profitability and conservative leverage, alongside explosive revenue growth. But its valuation is based on continued hyper-growth assumptions (7–8% revenue CAGR). Psychologically, investors are willing to pay exorbitant multiples because:
They anchor themselves to Nvidia’s remarkable growth up to the present.
- They have FOMO (fear of missing out) on AI.
- They herd during momentum cycles.
This makes Nvidia just as much of a fabulous long-term investment as it is a volatile short-term trade.
Nvidia Stock Prediction 2030: Scenarios
Nvidia’s stock prediction in 2030 requires navigating the market by considering both quantitative valuation models and qualitative business drivers. Three scenarios that correspond to different growth assumptions (7%, 7.5%, and 8% CAGR). Each one is a consideration not only of financial results, but also of the underlying forces that can drive them — and threaten them.
Base Case: 7.5% CAGR
It is our “anchor” scenario and the one underlying our recommendation. It takes for granted that Nvidia still rules the AI GPU roost, owns the data centres, and holds the lock-in to CUDA.
- CUDA as a moat: And by doing so, like Microsoft’s Windows locked in developers in the 1990s, CUDA means that once businesses are developed on top of Nvidia’s platform, the switching costs are massive.
- VAE Support: Value Added Earnings expand from $4.17 in 2025 to $5.89 in 2026 (a VAE Tailwind), and are indicative of a consistent capital-effective strategy.
- Behavioral finance connection: Investor sentiment still upbeat but not euphoric; expectations of growth in line with the fundamentals and not just speculative excess.
Nvidia (NVDA) stock Prediction for 2030, at approximately $203, is achievable, balancing growth with continued strength.
Bull Case: 8% CAGR
This outlook takes into account higher-than-anticipated adoption by hyperscalers, as well as automotive and robotics.
- Hyperscaler demand ramps: The Big Three cloud companies — Amazon, Microsoft, and Google could increase their capex budgets quite a bit if corporate and government adoption of generative AI accelerates.
- Auto AI moves faster: Nvidia’s DRIVE platform could see mass adoption by 2030, spinning a new revenue stream.
- Cash flow stabilizes: Free Cash Flow (FCF), which declined in 2025-2026 due to reinvestment, recovers to more than $20 billion each year; investors can be confident in reinvestment with no liquidity risk.
- Psychology: Herding drives upside as both retail investors and institutions pile on, feeding momentum.
NVIDIA’s stock Forecast for 2030 is expected to reach approximately $260, with a price target or even higher, due to an optimistic belief compounded by strong fundamentals. That would mean Nvidia needs not just to maintain its lead but to effectively expand into adjacent markets.
Bear Case: 7% CAGR
This is the bear case scenario, encompassing competitive, regulatory, and operational risks.
- Competition intensifies: AMD MI300 and Intel’s Gaudi series are gaining traction; hyperscalers like Google and Amazon are rushing to develop in-house AI chips, becoming less reliant on Nvidia.
- Geopolitical barriers: Tensions between the United States and China hinder Nvidia’s ability to compete in a crucial growth market. Export restrictions on high-end GPUs could limit revenues.
- Challenging cash-flow volatility: Reinvestment cycles extend liquidity, and if FCF remains volatile in nature (e.g., ranging somewhere between $10–$15B annually), investor patience could wane.
- Psychology: Some investors succumb to Nvidia’s anchoring bias of having been the one-time high flier and missed it again syndrome, while others panic and bolt in previous downturns.
- Nvidia stock Prediction for 2030 bottoms around $167, based on more conservative growth estimates and macroeconomic headwinds.
Catalysts
The catalysts are the forces that should realize upside beyond current expectations. For Nvidia, they represent both technological supremacy and market psychology.
Generative AI Adoption
- In 2022, the OpenAI ChatGPT release spurred enterprise and government AI adoption.
- Nvidia’s GPUs (A100, H100, Blackwell) still serve as a backbone for large language models and generative AI infrastructure.
- If other industries (in finance, health care, defense), embrace AI, hyperscalers’ appetite for Nvidia GPUs may go through the roof and lift earnings further than the base-case assumptions.
Impact on stock prediction: Continued AI adoption is suitable for the bull case ($259+ by 2030).
CUDA Ecosystem Lock-In
- CUDA has created something of a monopoly in the world of AI software to Microsoft’s grip on Windows.
- Organizations interested in running their code faster on NVIDIA silicon are likewise less likely to move to the AMD ROCm or the Intel options.
- This software stickiness raises pricing power many times, the recipe for Nvidia’s juicy margins (72–75% gross margin).
- Defends downside in the base and the doomsday case, bolsters Nvidia’s moat expansion story through 2030.
Automotive & Robotics Expansion
- Nvidia’s DRIVE platform is being put through its paces by Mercedes, Volvo and Chinese companies making electric vehicles.
- By 2030, automotive AI may become a multibillion-dollar annual revenue opportunity, alongside robotics and industrial AI.
- Impact: Diversification reduces reliance on data centers only.
Investor Psychology (Momentum & Herding)
- Nvidia is a “must-own” AI company. In AI hype cycles, both retail and institutional investors rush to invest in the stock, adding momentum.
- This can turn fundamentals on their head, with valuations getting blown out of all proportion (see: Nvidia +100x earnings in 2023).
- Impact: Short-term spikes can bring the stock closer to bull-case valuations.
No single factor drives Nvidia’s rise. There are several catalysts (thematic/financial/psychological) behind the $203 target and potential bull case upside.
Further Reading : Is Nvidia a Good Stock to Buy Now? Uncover Its True Market Value in 2025!
Risks
Every growth story has risks. For Nvidia, those risks are exacerbated because the stock trades on hyper-growth expectations. Any of that getting delayed could put Nvidia stock Prediction 2030 in reverse.
Valuation Risk
- Nvidia is trading at premium multiples (eg, >30x forward EBITDA vs 15x for peers).
- If revenues do not manage 7% growth, then the market could re-rate the stock towards deeper no-growth intrinsic value (~$47).
- Anchoring bias, where investors believe that Nvidia will always continue to grow at double digits. In times when growth slows down, panic selling may ensue.
Competition Risk
- AMD’s MI300 series and Intel’s Gaudi accelerators are competitive challenges.
- Hyperscalers (Google, Amazon, Microsoft) are developing in-house AI chips (e.g., Google’s TPU).
- If these alternatives erode Nvidia’s 90%+ market share in AI GPUs, margins and VAEs could compress.
- Bear case ($167 by 2030) may come to pass.
Geopolitical Risk
- Nvidia relies on TSMC in Taiwan to produce its chips. Any disruption (a China-Taiwan confrontation, United States export bans) could shrink supply.
- The most recent U.S. restrictions already blocked A100/H100 sales to China, costing billions in sales revenue.
- Impact: Expectations for growth would fall, which would be bad in all its scenarios.
Liquidity Risk
- Free Cash Flow (FCF) fluctuates with the investment cycle: peak is at $22.6B (Q1 2025), trough at $13.5B (Q2 2026).
- If reinvestment isn’t leading to comparable revenue growth, investors may lose faith.
- Impact: Raises volatility, especially in cyclical downturns.
Behavioral Risk
- Nvidia shares are prone to herding and speculative mania. Retail and institutional inflows exacerbate momentum during bull runs. The same herding will speed up declines in the positive corrections.
- The stock may trade beyond both upside and downside, playing out more like a risky short-term trading bet.
- Nvidia is solid financially, but its valuation gives it little room for error. Even modest upsets (such as competition, geopolitics, or liquidity) could tug the stock toward the bear case.
Conclusion and Recommendation
Today, Nvidia is the world’s definitive leader in AI infrastructure, with advanced GPUs, the CUDA software ecosystem, and investments in targeted areas such as automotive, robotics, and the Omniverse. Its financial base is excellent: gross margins are well in excess of 70%, operating margins are approximately 60%, net margins exceed 50%, and shareholder equity, which was nearly triple its 2021 level, is expected to be almost tripled by 2025.
Conservative leverage ratios and disciplined reinvestment add to Nvidia’s longer-term resilience. Using our comprehensive financial models, historical systems, and a data-driven approach, our Nvidia stock forecast for 2030 predicts a base case price of $203, with a 7.5% compound annual growth rate (CAGR) serving as the base case. Bull cases on increased adoption among hyperscalers and faster automotive AI revenues result in a $259.76 price.
At the same time, downside risks (more competition, geopolitical limitations, or cash flow volatility) could collectively cap the price at $167.09. That said, the Nvidia Behemoth within the AI computing space and its growing reach in adjacent sectors make it a compelling long-term bet. Investors should approach Nvidia, however, with patience and discipline: the stock’s premium valuation will continue to make it volatile, and psychological traps like fear of missing out or anchoring to previous explosive growth could cloud judgment. These days, it’s also a high-conversion buy for growth investors, institutional portfolios, and AI-focused funds, provided that it is held for the long term and with a diversified allocation.
Disclaimer
The content provided herein is for informational purposes only and should not be construed as financial, investment, or other professional advice. It does not constitute a recommendation or an offer to buy or sell any financial instruments. The company accepts no responsibility for any loss or damage incurred as a result of reliance on the information provided. We strongly encourage consulting with a qualified financial advisor before making any investment decisions.