Google stock prediction 2025 is a crucial topic for investors as Alphabet Inc. (NASDAQ: GOOGL), which is a parent firm of Google, remains among the most analyzed equities in the international markets. Its control in the spheres of advertising, cloud computing, and artificial intelligence (AI) contributes to investor trust, and such new technologies as quantum computing evoke even more enthusiasm. The investor community deliberates the Google stock forecast 2025 between robust fundamentals, alongside the issue of increasing expenses and declining cash flow.
In this article, we analyze Google’s stock prediction in 2025 based on stock valuation models, financial ratio analysis, and psychological factors. The discussion also involves more general market drivers like the emerging quantum world (Financial Times, 2025a; 2025b).
Valuation Insights from Value-Added Earnings Models
Our proprietary models, calculated using unlevered value-added earnings, give a range of results based on the assumptions about the discount rate. Central to this forecast is the 2025 value-added estimate of earnings of $7.25/share, increasing to $7.58 in 2026.
The following table is a summary of the Google stock price prediction in 2025 on varying discount rates:
| Discount Rate | No-Growth Price/Share | Growth Price/Share | Value-Adding Growth Rate | Market Implied Growth Rate |
| 4.5% | $103.64 | $179 | 6.04% | 5.38% |
| 5% | $103.64 | $197 | 6.04% | 5.38% |
| 6% | $103.64 | $248 | 6.04% | 5.38% |
Based on these assumptions, Google’s stock prediction for 2025 will lie between $179 $248 per share based on the growth and risk attitudes of investors. Psychology plays a crucial role in this scenario: an optimist would focus on either end of the $247 range, whereas value-conscious investors would be more inclined to consider the lower end of the scale at $179.
Financial Health and Balance Sheet Strength
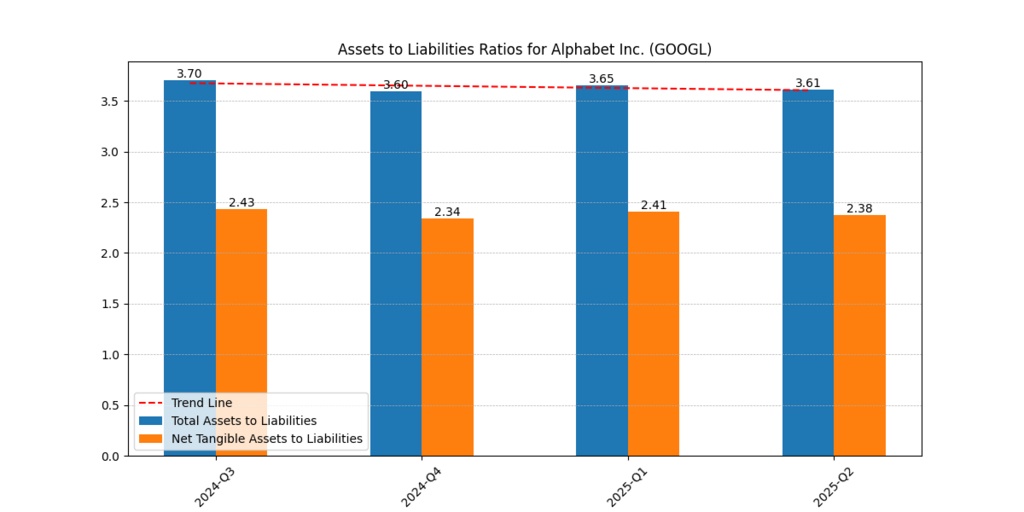
Figure 1: Alphabet Total and Net Tangible Assets to Liabilities Ratio (20242025), shows strong balance sheet resilience.
Alphabet has a stable assets-liabilities ratio that is always over 3.6x, indicating that the company is well covered. When calculated as net tangible assets/ liabilities, the ratio is well above the industry standards, with a ratio of more than 2.3x.
Meanwhile, the debt-share of the capital ratio does not exceed 6-9%, and the trend is slight but ascending. This financial fitness is reassuring to investors since Google can engage in high-intensity R&D spending and is not imperiled by solvency. This will come as reassuring to those considering the Google stock prediction 2025 because it offers a buffer against macroeconomic shocks.
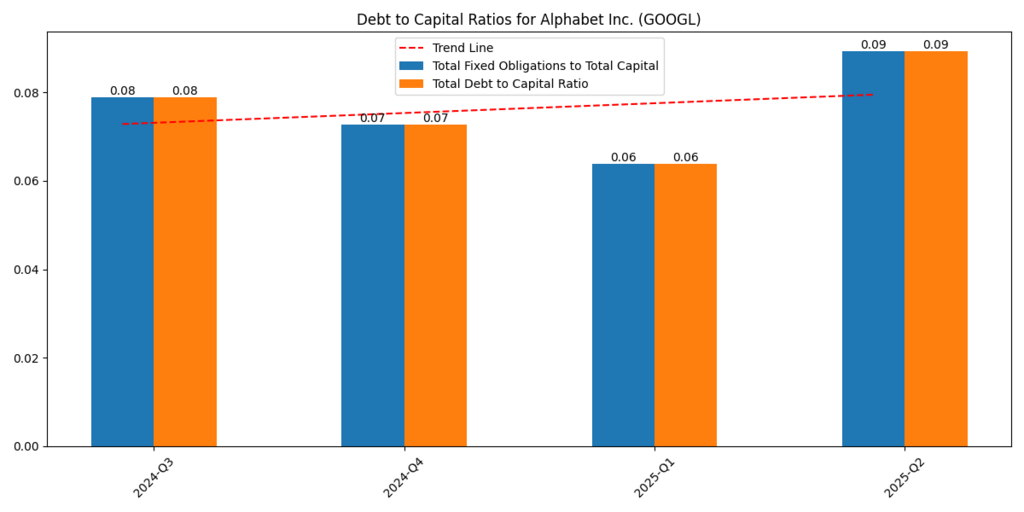
Figure 2: Alphabet’s Debt to Capital Ratios (2024–2025), indicating low leverage with a modest upward trend.
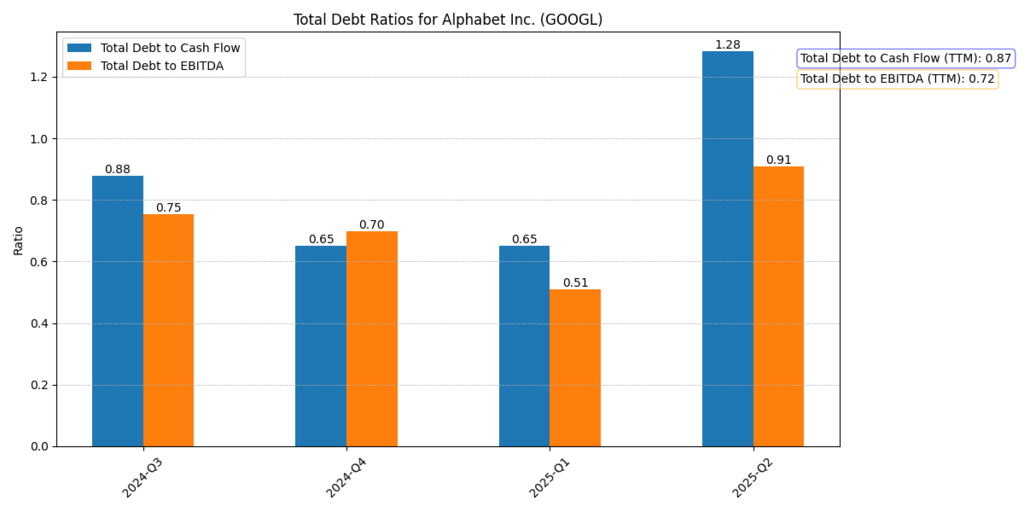
Figure 3: Alphabet Debt ratios, Alphabet Debt (2024-2025), verifying good debt coverage.
Cash Flow Dynamics and Expenditure Trends
The cash flow to expenditures ratio is also a concern, having plunged to 1.24 in Q2 2025 from 2.74 in Q4 2024. Although this indicates an increased capital intensity, it must be considered within the context of Google’s push into AI infrastructure, data centres, and quantum computing research.
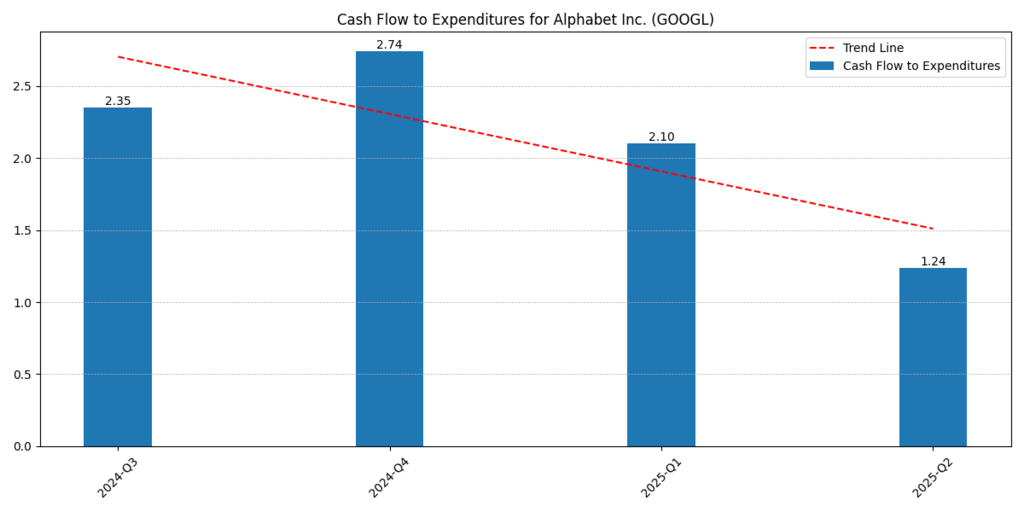
Figure 4: Alphabet Cash to Expenditure (2024-2025) illustrates that the cash flow to expenditure ratio will decrease as capex increases.
One-way investors can put a negative spin on declining free cash flow is that it is a transitory warning signal. However, experienced investors would view it more as an indicator of long-term strategic positions. It is typical of such duality between present-day caution and optimism in the long run.
Margins and operating efficiency
The gross margin of Alphabet has been steady at ~58- 60%, which reveals its capacity to monetize core operations effectively. But the operating and the net margins are volatile:
- Operating margin: 32–34%
- Net margin: 27–38%
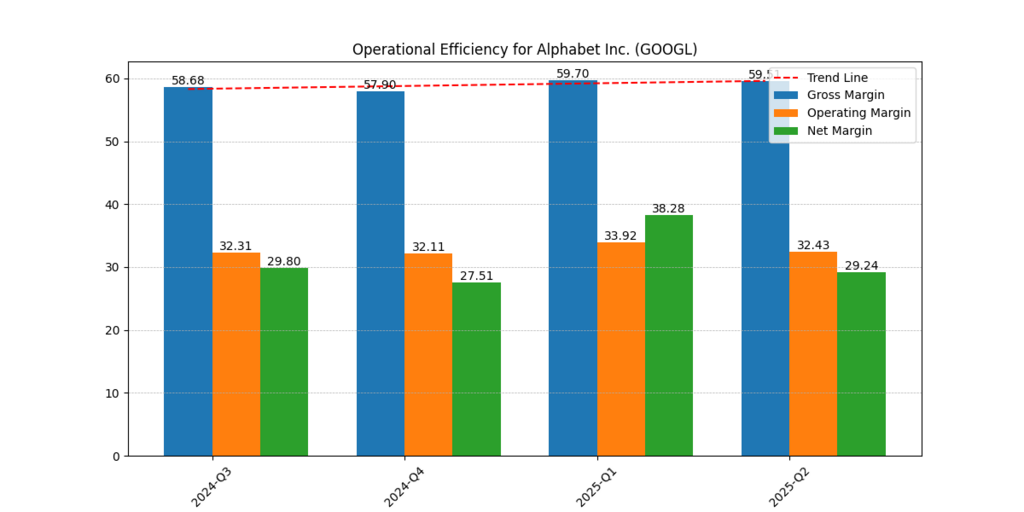
Figure 5 shows that the Gross margin, operating margin, and net margin (2024-2025) are more or less the same, indicating stable gross margins but varying operating and net margins.
This indicates a two-sided approach of the Google strategy: gross profit from ad and cloud revenues is resilient, whereas the R&D and capital expenditures are on the rise, which creates quarterly volatility. In the case of the Google stock price prediction 2025, baseline gross margins should be seen as indicators of sustained profitability despite fluctuations in the net margin. Revenue, EBITDA, and Free Cash Flow Trends.
The figures identify the rising trend of Alphabet revenue, which was at $88.2B in Q3 2024, and which is likely to increase to $96.4B in Q2 2025. EBITDA took a similar turn, soaring as high as $46.3B in Q1 2025 but dropping in free cash flow to the lowest value of simply $5.3B by Q2 2025.
| Quarter | Revenue ($B) | EBITDA ($B) | Free Cash Flow ($B) |
| 2024-Q3 | 88.27 | 35.75 | 17.64 |
| 2024-Q4 | 96.47 | 36.50 | 24.84 |
| 2025-Q1 | 90.23 | 46.31 | 18.95 |
| 2025-Q2 | 96.43 | 39.19 | 5.30 |
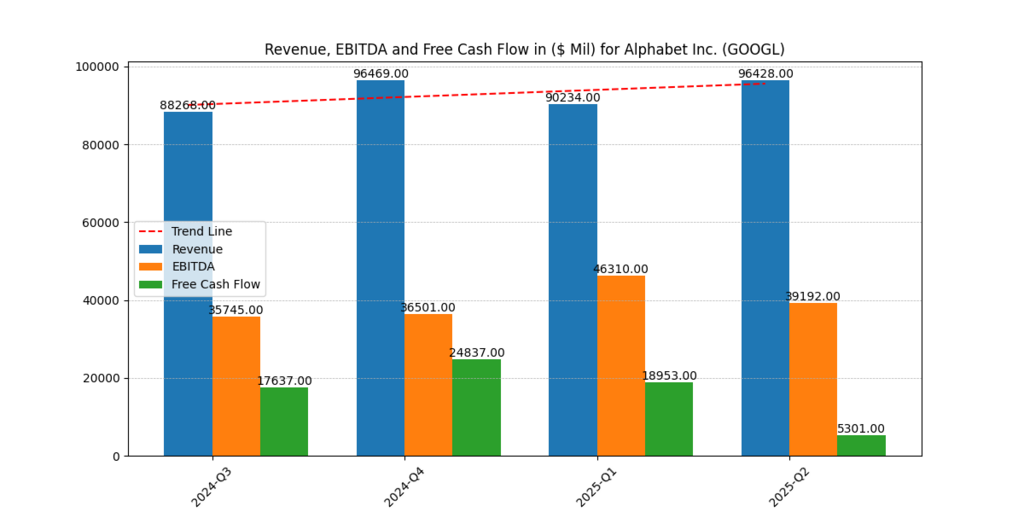
Figure 6: Quarterly revenue of Alphabet, its EBITDA, and free cash flow (2024- 2025), where we can see only revenue rise, but turbulence in free cash flow.
Alphabet’s quarterly ROE peaked at 10% (Q1 2025) but slipped to 7.8% (Q2 2025), while ROTC ranged from 8.6–11.3%. Notably, the TTM metrics remain outstanding:
This mismatch-high EBITDA and declining free cash flow-might provide contradicting investor enthusiasm. Ambitious traders will likely cheer on the revenue growth, whereas apprehensive investors may consider the risks of liquidity.
Return on Equity and Capital: Investor Returns
The quarterly ROE of Alphabet peaked in the second quarter of 2025, then decreased to 7.8%, while the ROTC fluctuated between 8.6- 11.3%. Notably, the TTM figures are excellent:
- ROE (TTM): 34.31%
- ROTC (TTM): 38.45%
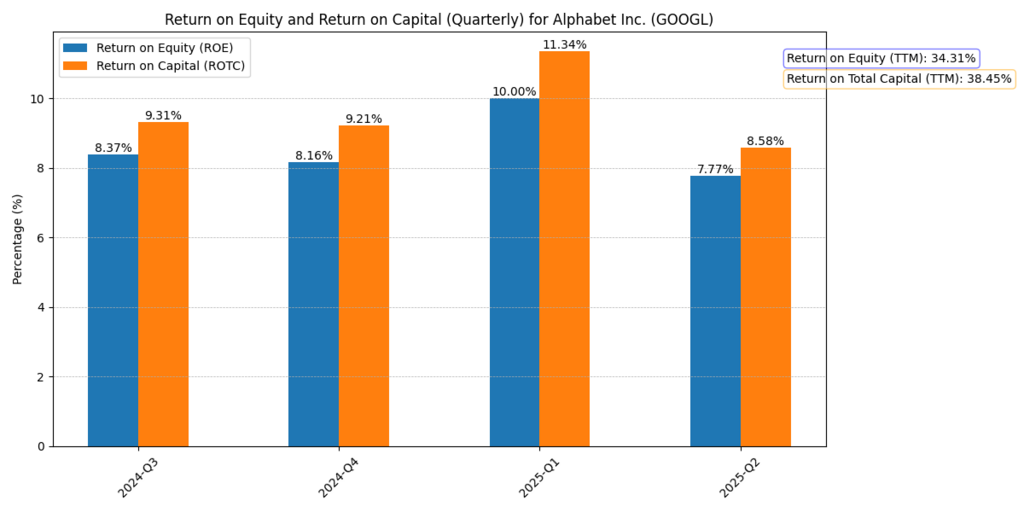
Figure 7: Alphabet Quarterly ROE and ROTC (2024-2025), in which strong twelve-month returns occur despite swings on a quarter-to-quarter basis.
These metrics strengthen the display of capital deployment over the long run, even though the quarterly results fluctuate. This is an indicator to the investor that, regardless of the spending efforts in quarters, Alphabet returns high shares to its investors.
Further Reading : Unlocking Value : Alphabet Stock Analysis After Q2 2025 Earnings
The Next Market Catalyst: Quantum Computing
Alphabet moonshots may significantly redefine its valuation, especially the part linked to quantum computation. According to the Financial Times (2025a, 2025b), Google and IBM reckon that the first viable quantum computer is just around the corner and will take the technological world to a new dimension.
From a psychological viewpoint, the announcement increases the effect of hype cycles, in which financial interest may occur before it has a real impact. But should Google bring quantum to market ahead of competitors, the technology could present an order-of-magnitude explosion in business potential, according to cloud, cybersecurity, and machine-learning markets, an upside that can not be accurately reflected in existing models.
Google Stock Prediction 2025: Unveiling Future Scenarios for Investors
Based on valuation models, financial performance, and market catalysts, there are three scenarios:
- Bull Case ($248/share): Reached with an under-6 percent growth base, quantum breakthroughs, AI-based advert dominance, and stable revenue growth.
- Base Case ($197/share): 5.0% of discount projection, signifying ongoing digital ads and cloud strength, and balanced spending.
- Bear Case ($179/share): A less-optimistic scenario that incorporates free cash flow pressure and conservative investor psychology.
This spread symbolizes the two trends of increasing expenditures with the radicalizing innovation, a dilemma that characterizes the Google stock forecast in 2025.
Conclusion
Alphabet is at a crossroads in 2025. It has a strong financial position, low debt base, and a resilient operating base. However, the free cash flow has decreased significantly, and capital expenditures have increased, which will make investors wary. According to the Google stock prediction 2025, the range of valuation will vary considerably ($179-$248), and the results will depend not only on fundamentals but also on the mood of the market and the upcoming activities in the field of quantum computing. Long-term investors should not be negatively affected by the short-term fluctuations, as Google continues to be a story of innovation-based growth.
Disclaimer
The content provided herein is for informational purposes only and should not be construed as financial, investment, or other professional advice. It does not constitute a recommendation or an offer to buy or sell any financial instruments. The company accepts no responsibility for any loss or damage incurred as a result of reliance on the information provided. We strongly encourage consulting with a qualified financial advisor before making any investment decisions.