AI Stocks Fundamental Analysis is essential in determining whether stocks in the burgeoning artificial intelligence sector are reasonably priced. Artificial intelligence is no longer a hyped concept; instead, companies are making it the center of their strategy. The four – Microsoft, Alphabet (Google), Meta, and NVIDIA – lately known as the AI Big Four – have evolved into the standard investment of transformation. To truly assess the value of these stocks, the investor must delve into surface multiples and undertake a laborious analysis of their fundamentals. (Damodaran, 2023; Penman, 2021).
Such a view is essential to investors. The AI industry has been marked with extreme volatility, heavy capital spending, and its diversified monetization strategies. Other companies, such as Microsoft and Google, rely on the incorporation of AI in current revenue streams, and others, such as NVIDIA, thrive on the demands of specialized hardware. Meta, on the other hand, is trying to use both near-term profitability and intensive investment in infrastructure (Microsoft Corporation, 2025; Alphabet Inc., 2025; Meta Platforms, Inc., 2025; NVIDIA Corporation, 2025).
Microsoft (MSFT)
The monetisation of AI via Microsoft follows the supply chain through Azure, Copilot, and enterprise productivity to sustain recyclable cash flows (Microsoft Corporation, 2025). Also, in your models, unlevered P/E and unlevered P/B pass a screen of premium but are reinforced by constant value added in residual earnings form (Penman, 2021).

Figure 1: Forward ROE estimates used in residual income modeling for Microsoft Corporation.
Fair Value Analysis for MSFT
| Metric | MSFT (7.5% Growth) | MSFT (7.6% Growth) |
| Market Price | $535.14 | $535.14 |
| Predicted Growth Price | $585.27 | $614.22 |
| No-Growth Price | $153.49 | $184.13 |
| ROE (Year 1) | 33% | 39% |
| Residual Earnings Y1 | $10.84 | $10.84 |
| Residual Earnings Y2 | $13.42 | $13.42 |
| Unlevered P/E | 32.56× | 33.21× |
| Unlevered P/B | 13.53× | 14.02× |
Interpretation
Based on the analysis, there is the potential for 10 to 15 percent upside with forecasted prices being higher than the present stock market values. However, unlevered multiples are on a premium basis, and the high and stable ROE (TTM 32.5%) and a sound free cash flow generation are what justifies it at Microsoft (MSFT Q4 Results, 2025).
Alphabet / Google (GOOGL)
The financial charts you gave on Alphabet (margins, revenue trajectories, assets-to-liabilities) show that it is a company with stable operating efficiency and a robust balance sheet, and thus the company has the best risk profile of the four due to unlevered multiples and cash-reinvestment needs (Alphabet Inc., 2025; Damodaran, 2023). In the absence of a specific GOOGL Excel model, the charts presented in the upload help to support a defensive allocation to AI with plenty of room left to continue allocating to AI infrastructure spend (Alphabet Inc., 2025).
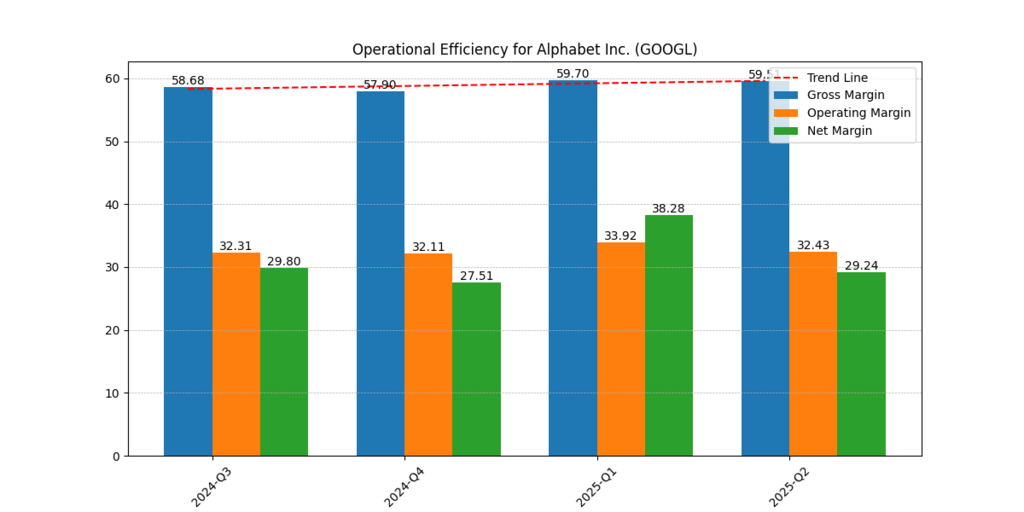
Figure 2: The high operating efficiency of Alphabet and its consistent ROE demonstrates its low-risk AI valuation profile.
Valuation Highlights for GOOGL
- ROE: ~32–33% across 2025–2026 (charts).
- Residual Earnings: Positive, though growth is steady rather than explosive.
- Predicted Growth Price/Share: ≈ $223
- Unlevered P/B: Moderate, reflecting significant net cash reserves.
Interpretation
A low-risk AI play is Google, which has a fortress balance sheet (assets-to-liabilities ~3.6x) and high ROE. It will trade slightly above intrinsic value because there is low upside potential, and thus, it becomes the anchoring stability in AI stocks.
Meta Platforms (META)
Meta’s models have strong value generation across multiple growth scenarios, aided by advertising cash flows as well as leveraging AI infra (Meta Platforms, Inc., 2025). Unlevered multiples are milder compared to peers, allowing META value tilt in this AI Stocks Fundamental Analysis (Damodaran, 2023).
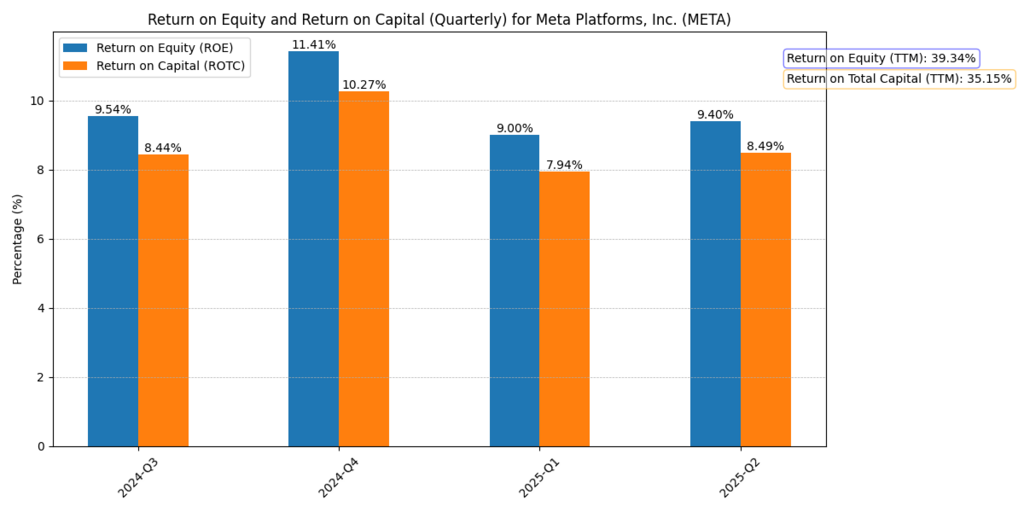
Figure 3: Residual earnings projections for Meta highlight robust value creation under varying growth assumptions.
Price Prediction for META
| Metric | META (6.5% Growth) | META (6.7% Growth) | META (6.9% Growth) |
| Market Price | $773.55 | $773.55 | $773.55 |
| Predicted Growth Price | $809.02 | $858.02 | $913.77 |
| No-Growth Price | $304.98 | $316.55 | $326.16 |
| ROE (Year 1) | 39% | 39% | 39% |
| Residual Earnings Y1 | $20.85 | $20.85 | $20.85 |
| Residual Earnings Y2 | $22.17 | $22.17 | $22.17 |
| Unlevered P/E | 26.07× | 26.07× | 26.07× |
| Unlevered P/B | 9.14× | 9.14× | 9.14× |
Interpretation
Meta has 5-18% of upside under any growth assumptions. It has low unlevered multiples relative to Microsoft and NVIDIA, implying that it is the value stock in the AI space. The danger is execution: considerable costs in AI infrastructure have to be converted into the monetization of engagement.
NVIDIA (NVDA)
The model NVIDIA published underlines rapid growth and a high valuation: both unlevered P/E and unlevered P/B are the top of the cohort, and PGPS is below the current share price in your run —a red flag indicating that much growth has already been priced (NVIDIA Corporation, 2025; Damodaran, 2023).
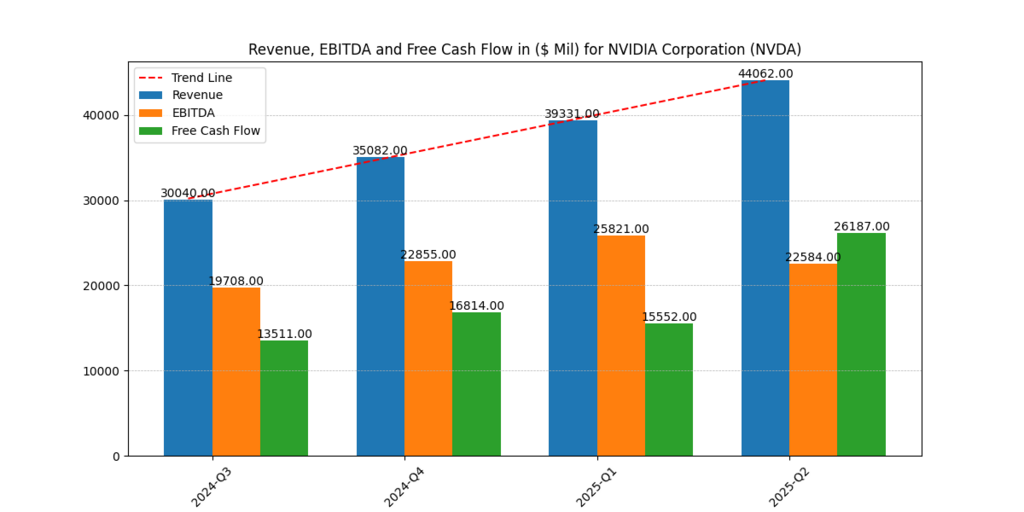
Figure 4: The good fundamentals are based on the explosive revenue growth and margin expansion recorded by NVIDIA, but this poses valuation risk.
Valuation Analysis for NVDA
| Metric | NVDA |
| Market Price | $181.60 |
| Predicted Growth Price | $142.24 |
| No-Growth Price | $50.05 |
| ROE (Year 1) | 133% |
| ROE (Year 2) | 169% |
| Residual Earnings Y1 | $3.97 |
| Residual Earnings Y2 | $5.42 |
| Unlevered P/E | 38.48× |
| Unlevered P/B | 87.11× |
Interpretation
NVIDIA has leading fundamentals, with operating revenues increasing from $26.9B in 2022 to $ 130.5B in 2025, and net margins of approximately 56%. However, the valuation is extended: the market already reflects an extremely high growth rate, with little remaining upside compared to an intrinsic-based valuation. This puts NVIDIA as the high-risk, high-reward AI bet.
Further reading : Best Penny AI Stocks to Buy in 2025: Read It Before You Buy
Comparative Analysis
| Company | Unlevered P/E | Unlevered P/B | ROE (Forward) | Residual Earnings Y1 | Residual Earnings Y2 | Predicted Growth Price | Upside vs Market |
| Microsoft | 32.56–33.21× | 13.5–14.0× | 33%–39% | $10.84 | $13.42 | $585–614 | +10–15% |
| Alphabet | Moderate | Moderate | ~32–33% | Positive | Stable | ~$585 | Moderate |
| Meta | 26.07× | 9.14× | 39% | $20.85 | $22.17 | $809–913 | +5–18% |
| NVIDIA | 38.48× | 87.11× | 133%–169% | $3.97 | $5.42 | $142 | Limited |
Conclusion
Within the AI Stocks Fundamental Analysis, Microsoft, Google, Meta, and NVIDIA have different roles, which are brought out in the AI Stocks Fundamental Analysis. Microsoft is a stable source of growth with reliable cash generation, whereas Google has the least risky deployment due to its strong balance sheet and steady profitability. Meta emerges as the value play, with more reasonable multiples, but it also has excellent upside potential.
By contrast, NVIDIA is the unambiguous winner of growth, boasting simply insane revenue and margin growth, but this premium price leaves a small margin of error. The optimal approach investors can take is a combination of growth opportunities and valuation discipline. A balanced exposure across the AI Big Four allows an investor to capture the AI potential of transformation and decrease the risk exposure of any one company.
Disclaimer
The content provided herein is for informational purposes only and should not be construed as financial, investment, or other professional advice. It does not constitute a recommendation or an offer to buy or sell any financial instruments. The company accepts no responsibility for any loss or damage incurred as a result of reliance on the information provided. We strongly encourage consulting with a qualified financial advisor before making any investment decisions.