Analyze Chevron stock forecast 2025 with insights on crude oil prices, cash flow strength, and renewable energy moves. See if CVX is set to beat the market. Examine whether the CVX stock forecast for 2025 will outperform the market. With operations spanning upstream exploration, downstream refining, and expanding renewable energy, Chevron Corporation (NYSE: CVX) remains one of the most integrated oil and gas companies in the world. For energy titans, 2025 presents both opportunities and challenges, as geopolitical shifts, decarbonization policies, and global crude demand influence earnings power. When examining the 2025 Chevron stock forecast, investors want to know whether the company will outperform its competitors or if the volatility of oil prices will impact returns.
This article combines value-added earnings (VAE) analysis from proprietary models, Chevron’s most recent financial data, and analyst expectations. We also go into the psychological aspects that influence investor behavior, such as long-term patience and FOMO.
Chevron Stock Forecast 2025-Analyst Consensus vs. Proprietary Forecasts
Chevron’s 12-month price goals, as reported by 23 analysts, range from $124 to $197, with a median target of $170, which is an 8.83% increase from the company’s most recent price of $156.21.
Using value-added earnings modeling and a 10% hurdle rate, our proprietary projection predicts that the price of Chevron stock will range from $170 to $206 per share in 2025. Stronger cash flow estimates and careful capital allocation are reflected in this marginally higher band (Financial Times, 2024a).
Table 1: Analyst Consensus vs. Proprietary Forecast
| Forecast Source | Low Estimate | Median Estimate | High Estimate | Proprietary Range |
| Analyst Consensus (23) | $124 | $170 | $197 | – |
| Proprietary VAE Forecast | – | – | – | $170 – $206 |
Balance Sheet Strength: Assets vs. Liabilities
In comparison to its counterparts, Chevron maintains a conservative balance sheet. Between 2024 and 2025, the assets-to-liabilities ratio remained above 2.4x, indicating sufficient asset coverage. Nonetheless, the oil industry’s high capital intensity is evident in the declining trend of net tangible assets to liabilities, which ranges from 1.36 to 1.48 times the value of liabilities.
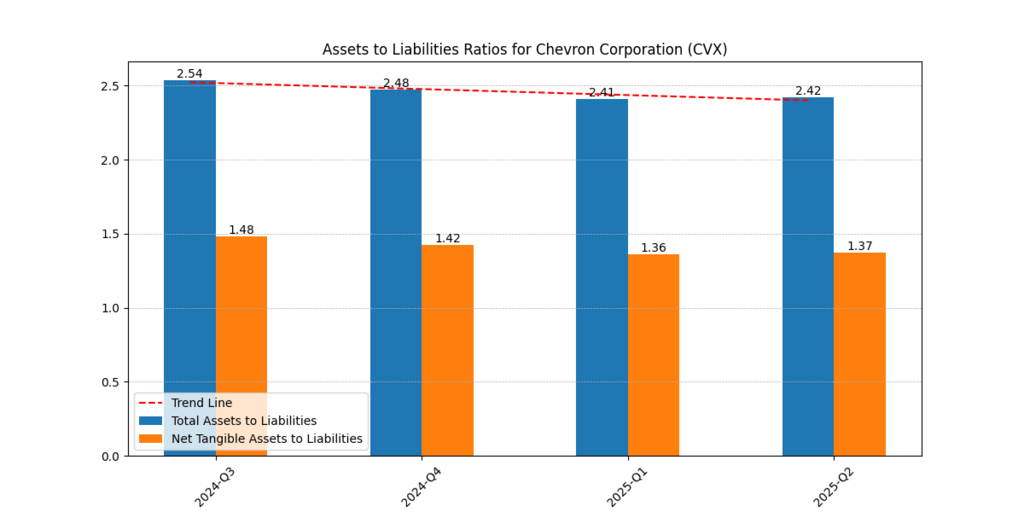
Figure 1: Chevron’s asset-to-liability ratios for 2024–2025 are shown. Ratios above 2.4x demonstrate high asset coverage in relation to liabilities, although there is a minor decline.
A slight decline in total coverage ratios, although they are still in good shape as compared to industry averages. Investors view this as Chevron’s defense against debt risk, which is a significant asset during times of commodity decline.
Coverage Ratios: EBIT and EBITDA Decline
Between Q3 2024 and Q2 2025, Chevron’s EBIT coverage ratio dropped precipitously from 40.57x to 16.14x. During the same time span, EBITDA coverage also declined, going from 66.36x to 32.23x.
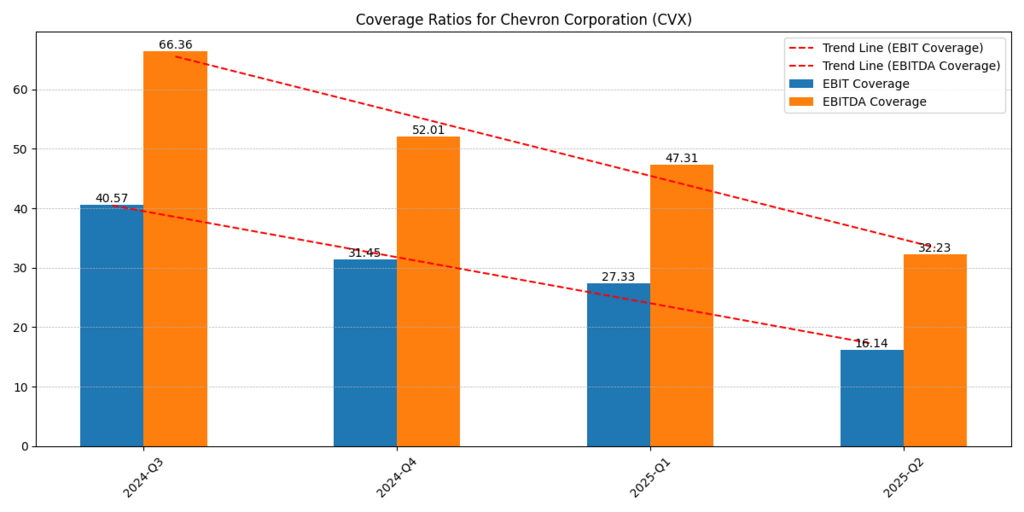
Figure 2: Chevron’s EBIT and EBITDA Interest Coverage Ratios (2024–2025). A downward trend suggests a smaller earnings buffer to cover debt payments.
The decreasing trend indicates a dwindling earnings buffer against interest commitments, even though these are still far from solvency danger zones. Given that earnings volatility remains strongly correlated with Brent and WTI pricing, this data highlights the reason analysts maintain conservative price targets.
Operational Efficiency and Margins
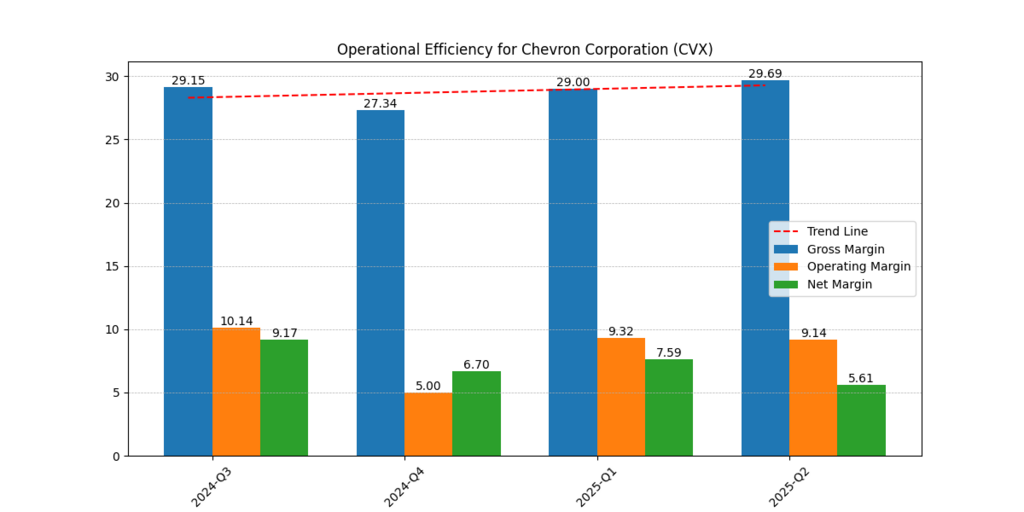
Figure 3: Operating, Net, and Gross Margins for Chevron, 2024–2025. Gross margins remain unchanged, but growing operating expenses are causing a compression of the net margin.
Chevron’s net margin shrank to 5.6% by Q2 2025, its operating margin varied between 5% and 10%, and its gross margin remained between 27% and 30%.
- Benefit: Despite fluctuations in the energy market, gross margins exhibit consistency.
- Drawback: Compression of the net margin suggests increased expenses, which may be related to inflation in exploration and renewable energy investments.
Margin resiliency is reassuring, but diminishing profitability calls for close observation for investors wondering if Chevron stock is a good investment in 2025.
Revenue, EBITDA, and Free Cash Flow
From $48.9 billion in 2024-Q3 to $44.3 billion in 2025-Q2, revenue declined. EBITDA came next, dropping from $10.9 billion to $8.8 billion. High volatility was observed in free cash flow, which declined to $1.26 billion in Q1 2025 before increasing to $4.86 billion in Q2.
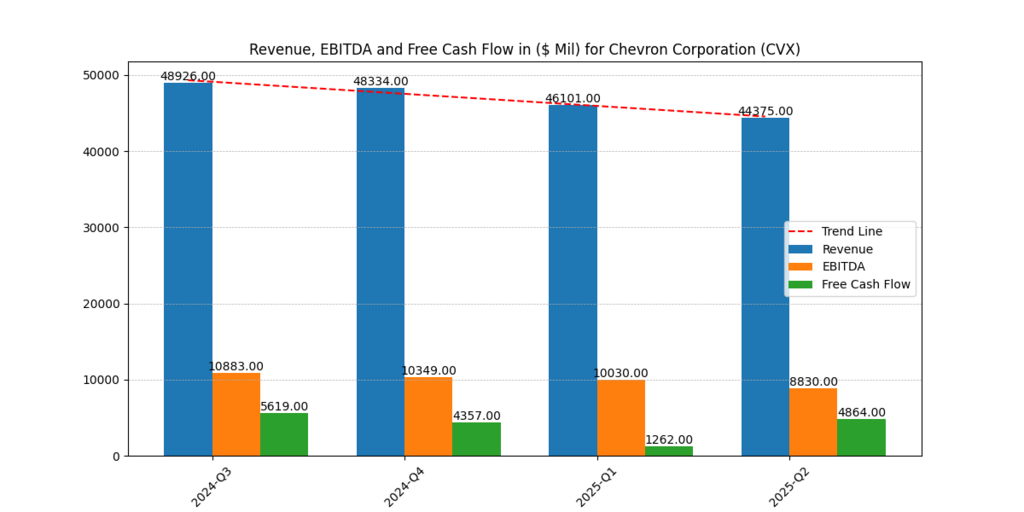
Figure 4: Chevron’s revenue, EBITDA, and free cash flow in millions of dollars (2024–2025). EBITDA and revenues are trending downward, and the unpredictability of free cash flow highlights cyclical pressures.
Strong free cash flow enables debt reduction, dividend payments, and share buybacks; thus, its volatility is crucial. A sustained decline in FCF might unnerve income-oriented investors, given that Chevron’s dividend safety is a key component of its investment case.
Return on Equity (ROE) and Return on Total Capital (ROTC)
In 2025-Q2, ROE decreased to 1.7% and ROTC to 2.5%, both of which were lower than in previous quarters. However, ROE and ROTC stay at 9.04% and 12.89%, respectively, on a trailing-twelve-month basis, which is consistent with industry standards.
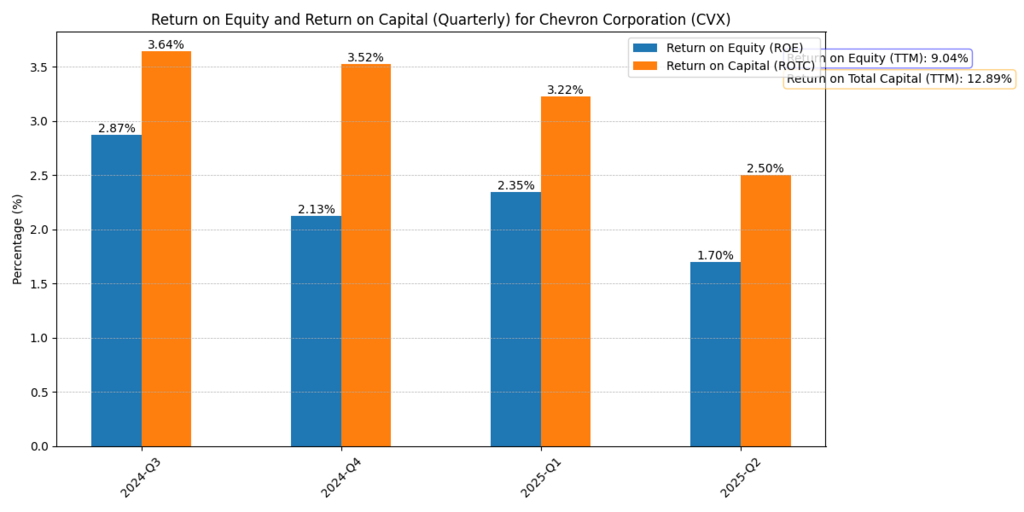
Figure 5: These figures illustrate a cyclical dip rather than a structural decline. Investors with long-term horizons often discount short-term ROE dips, especially in capital-intensive sectors like oil.
Peer Comparison (Benchmark for Oil Stocks)
Chevron displays the following:
- Comparable EBITDA margins, although falling short of Exxon in efficiency;
- Higher asset coverage ratios than Exxon.
- Increased volatility in free cash flow, which reflects cyclicality and resilience.
These figures show a cyclical decline rather than a fundamental worsening. Short-term drops in ROE are usually underestimated by long-term investors, especially in capital-intensive sectors like the oil industry.
Table 2 — Chevron vs. ExxonMobil (2025 Snapshot)
| Metric | Chevron (CVX) | ExxonMobil (XOM) |
| Assets/Liabilities | ≈2.4x | ≈2.1x |
| EBITDA Margin (%) | ≈21% | ≈23% |
| ROE (TTM %) | 9.37% | 11.81% |
| ROTC/ROIC (TTM %) | 13.09% | 14.89% |
| Free Cash Flow Volatility | High | Moderate |
This comparison highlights the company’s poor margin trajectory and strong balance sheet.
Investor Psychology and Market Sentiment
Both investor psychology and fundamentals heavily influence the Chevron stock forecast for 2025.
- Herding Behavior. Chevron is a benchmark investment for many institutional funds due to its size and standing as a blue-chip energy firm. Retail investors often follow these big players when they build up or hold onto investments, as they believe the “smart money” is right (Shiller, 2021).
- FOMO, or the fear of missing out. When oil prices rise, energy equities tend to experience a significant upswing. Investors flock to firms like Chevron in these conditions because of the fear of missing out on rapid profits. In the near term, this momentum-driven mindset may cause the stock to exceed its actual value, thereby bolstering Chevron’s valuation advantage over its competitors.
- Extended endurance. Many investors view Chevron as both a dividend anchor in their portfolios and a cyclical bet. Long-term holding behavior is encouraged by the trust fostered through its steady dividend history. These investors provide pricing stability during downturns by being ready to “wait it out” even when short-term ROE or margins decrease.
In reality, this means that investor psychology increases trust in CVX’s robustness, which may keep it closer to the upper bound of its predicted range ($170–$206), particularly when compared to smaller, more volatile oil companies.
Renewable Energy Transition
Chevron has accelerated its diversification into low-carbon energy initiatives, including renewable fuels, hydrogen production, and carbon capture and storage (CCS). Significant upfront capital expenditures are necessary for these activities, which helps to explain why the company’s quarterly results recently showed a compression in net margins. Although these expenditures may lower short-term profitability, they are strategically significant in positioning CVX to thrive in a climate where investors and regulators are placing greater emphasis on sustainability and decarbonization.
Historically, traditional oil corporations have been shunned by many institutional funds that adhere to environmental, social, and governance (ESG) standards. Chevron is re-attracting ESG capital by showcasing credible commitments to renewable projects, which can support better valuation multiples in comparison to peers that are only focused on fossil fuels (Financial Times, 2024b).
Additionally, Chevron’s approach strikes a balance between investing in next-generation energy infrastructure and protecting shareholder returns through buybacks and dividends. While using its cash-rich upstream business to finance future expansion, this dual-track strategy reassures long-term investors that the company is not unduly dependent on erratic crude oil cycles.
Further Reading : APA vs. OXY Energy Stocks: Evaluating Investment Potential—Which One Should You Buy in 2025?
Final Outlook: Is Chevron stock a buy in 2025?
According to the data, Chevron’s stock price prediction for 2025 is expected to be between $170 and $206 per share.
- Bullish Case ($200+): Cash flows improve, renewable energy development picks up speed, while crude oil stabilizes above $90.
- Bearish Case (~$150): Free cash flow volatility erodes dividends, margins continue to tighten, and oil demand declines.
- Base Case ($170–$180): Moderate appreciation, dividend consistency, and balanced performance.
Whether Chevron stock is a good investment for investors in 2025 depends on their risk tolerance. Chevron’s dividend yield and asset coverage might appeal to conservative investors. Before investing, growth-oriented investors may search for more potent triggers.
Conclusion
Chevron is situated at the nexus of renewable transformation and energy security. Both cyclical susceptibility and resilience are reflected in the CVX stock forecast 2025. Although concerns exist regarding crude prices and the reliability of free cash flow, Chevron offers upside potential with a projected trading range of $170 to $206.
Chevron remains a key investment for investors seeking consistent dividend payments. Before breaking higher, the stock may require confirmation from the oil markets to provide momentum for traders.
Whether Chevron succeeds in the oil and gas industry by 2025 will ultimately depend on its ability to strike a balance between generating cash from fossil fuels and investing in renewable energy.
Usama Ali
Usama Ali is the founder of Financial Beings and a self-taught investor who blends classic valuation study with insights from psychology. Inspired by works from Benjamin Graham, Aswath Damodaran, Stephen Penman, Daniel Kahneman, and Morgan Housel, he shares independent, data-driven research to help readers connect money, mind, and happiness.
Disclaimer
The content provided herein is for informational purposes only and should not be construed as financial, investment, or other professional advice. It does not constitute a recommendation or an offer to buy or sell any financial instruments. The company accepts no responsibility for any loss or damage incurred as a result of reliance on the information provided. We strongly encourage consulting with a qualified financial advisor before making any investment decisions.