Apple or Microsoft stock in 2026? Apple stock vs. Microsoft stock on valuation, intrinsic value sensitivity, dividends and expected returns, the article compares the two stocks to find out which is the smarter investment today.
Apple or Microsoft Stock in 2026: What This Comparison Covers
The two significant mega-cap technology stocks in the global markets are still Apple and Microsoft. In 2026, investors are not only posing a question of which company is the better one. They are posing a valuation question: what is the smarter stock to buy today based on growth prospects already reflected in the share price? Apple is with a price of $255 per share, and Microsoft is with a price of $401 per share, which is in line with the market price indicators.
This comparison addresses the focused areas that are of the greatest concern in deciding in 2026. The first one is the side of business model strength: the Apple consumer ecosystem and service expansion vs Microsoft cloud and enterprise subscription engine. Second, it considers the AI plan of the further development, since AI is the most important story that may explain the higher growth rates than GDP. Third, it evaluates valuation based on sensitivity of intrinsic values under long-term growth assumptions of between 2%- 8% and then it interprets what the market is seemingly pricing in. Fourth, it converts the analysis to growth, conservative and balanced investor portfolio recommendations.
Table 1: Comparison between Apple and Microsoft
| Metric | Apple (AAPL) | Microsoft (MSFT) |
| Current Price | $255 | $401 |
| Intrinsic Value at 6% Growth | ~$221 | ~$379 |
| Residual Earnings per Share (2025) | ~$7.1 | ~$10.0 |
| Dividend per Share (2025) | $1.04 | $3.24 |
| Dividend Yield (2025) | ~0.55% | ~0.87% |
Readers seeking company-specific deep dives may also explore our standalone valuation reports on Apple and Microsoft, where intrinsic value drivers are modeled in isolation.
The residual earnings and dividend income of Microsoft are higher and better in the latter year presented. Apple has strong ecosystem potential and high operating leverage potential, but the valuation remains heavily reliant on sustained growth.
Apple Stock vs Microsoft Stock: Business Model Strength in 2026
Apple’s Ecosystem, Services Expansion, and Hardware Dependency
The strategic strength of the Apple company is its ecosystem. The products that the company offers are meant to function in a way that leads to customer loyalty and decreased switching. The outcome is high user retention capability, upgrades sales and an increase in service usage as time goes by. Service growth is important since services are recurrent and sticky that can make cash flows more predictable than single hardware sales.
In the year 2026, the bull case of Apple is that with the expansion of services and monetization of the ecosystem, it can continue to grow long-term above GDP even when the hardware growth slows down. A more detailed breakdown of Apple’s near-term growth psychology and pricing power dynamics is available in Apple Stock Price Prediction 2026: Financial, Strategic, and Psychological Analysis of Apple’s Growth Outlook. The bear case is if the hardware demand slows down and the services fail to offset it, the growth profile that the company followed may shift towards the 2%-3% band.
Microsoft’s Cloud, Enterprise AI, and Recurring Revenue Engine
Recurring enterprise revenue is the strength of Microsoft. Its operation is centred on the long-term partnership with the organizations that pay on an ongoing basis for the productivity software, cloud service, and platform tools. Its structure has the tendency to lower volatility as enterprise technology spending is usually contracted and integrated into the business process. The company focuses on its platform and cloud future and explains how AI can be incorporated throughout all product lines, such as productivity tools and cloud services (Microsoft Investor Relations, 2025).
This is important to the valuation in a highly practical sense. When two stocks require approximately equal growth to explain the existing prices, the one with the more long-lasting and repeatable revenue pattern can be a lot more secure because it has the avenues to increased growth that are more evident. The 2026 case Microsoft makes is that the adoption of cloud and enterprise AI can enable sustainable growth at the levels suggested by the stock price, and also enable further increase in profitability.
Apple vs Microsoft Stock: Revenue Growth and AI Strategy Comparison
The two corporations are in a position to gain the advantages of AI in different ways. The AI strategy by Apple is mainly ecosystem-driven. The AI features advance the usefulness of the device, provide a better user experience, and facilitate interaction with Apple services. The monetization of Apple is often indirect and is thus achieved through better experiences; stronger protection of pricing power, stimulation upgrades, and the increased use of the ecosystem. It can still be strong, though it is connected with consumer behaviour and product cycles.
The enterprise channel is a more direct way of monetizing the AI strategy at Microsoft. The AI capabilities are offered as subscription upgrades, enterprise productivity solutions, and cloud computing services. This strategy will make AI a quantifiable source of revenue in contractual models. Investor reporting at Microsoft facilitates the argument that the AI is not just a peripheral feature, but a product and platform strategy embedded within Microsoft products (Microsoft Investor Relations, 2025).
Table 2: AI Monetization Model
| Company | How AI Supports Growth in 2026 |
| Apple | Strengthens ecosystem value, supports device upgrades and services engagement |
| Microsoft | Drives enterprise subscriptions and cloud demand through direct AI-enabled products |
This does not mean that AI is better or worse. The practical question of investment is to what extent AI will be reliably turned into a long-term growth that would justify today’s valuation.
Apple Stock vs Microsoft Stock: Valuation Analysis (2026)
Intrinsic Value Sensitivity Under 2%–8% (Interactive Chart)
| Growth (%) | AAPL IV ($B) | AAPL P/Share | AAPL V/P % | MSFT IV ($B) | MSFT P/Share | MSFT V/P % | Δ V/P |
|---|
Microsoft’s intrinsic value per share on long-term growth assumptions is between 2%-8%, and the current price reference is at $401.
Even a slight variation in the assumed long-term growth produces a massive variation in the intrinsic value. In a low-growth world, both companies are overvalued. Both companies exhibit material growth in a high-growth world. A longer-term valuation framework extending to 2030 is discussed in Apple Stock Forecast 2030: Valuation Based Analysis of Intrinsic Value and Expected Returns, where multi-stage fade assumptions are explored in depth.
Table 3: Intrinsic Value Sensitivity Comparison
| Growth Assumption | Apple Intrinsic Value | Microsoft Intrinsic Value |
| 2% | ~$113 | ~$212 |
| 4% | ~$149 | ~$270 |
| 6% | ~$221 | ~$379 |
| 8% | ~$436 | ~$710 |
This is the valuation reality table. The intrinsic value of Apple at 2% growth is way down to less than $255, and Microsoft at 2% growth is way down to less than $401. Following 6% growth, the two approach the market price, though slightly lower. Both have strong upside considering a long-term growth rate of 8%.
The greatest lesson should not be that the stocks are either good or bad. The point is that the decision to invest in 2026 will be the subject of significant debate about whether these companies can continue to grow significantly above GDP over a long period of time and whether AI and business model sustainability can render such a trajectory possible.
Implied Growth: What Is the Market Pricing In?
A company whose stock is trading higher than the intrinsic value, under the conditions of moderate growth, is implicitly predicting faster growth. The price of Apple stock is close to the intrinsic value between 6 and 7%. The price of Microsoft is also in the range of 6% and 7%, with its current price being $401.
Investors questioning whether this implied growth is realistic can explore a deeper valuation breakdown in Is MSFT Stock a Buy or a Value Trap in 2026 After Falling 12%?, where downside scenarios and sentiment compression are analyzed in detail. That is, the market is essentially valuing both companies as long-term growth stocks that are required to be able to grow at rates higher than those of GDP.
That is why the issue of narrative is relevant in 2026. The valuation can be justified by AI, ecosystem monetization, cloud expansion, and enterprise demand, which can facilitate continued growth of about 6%-7%.
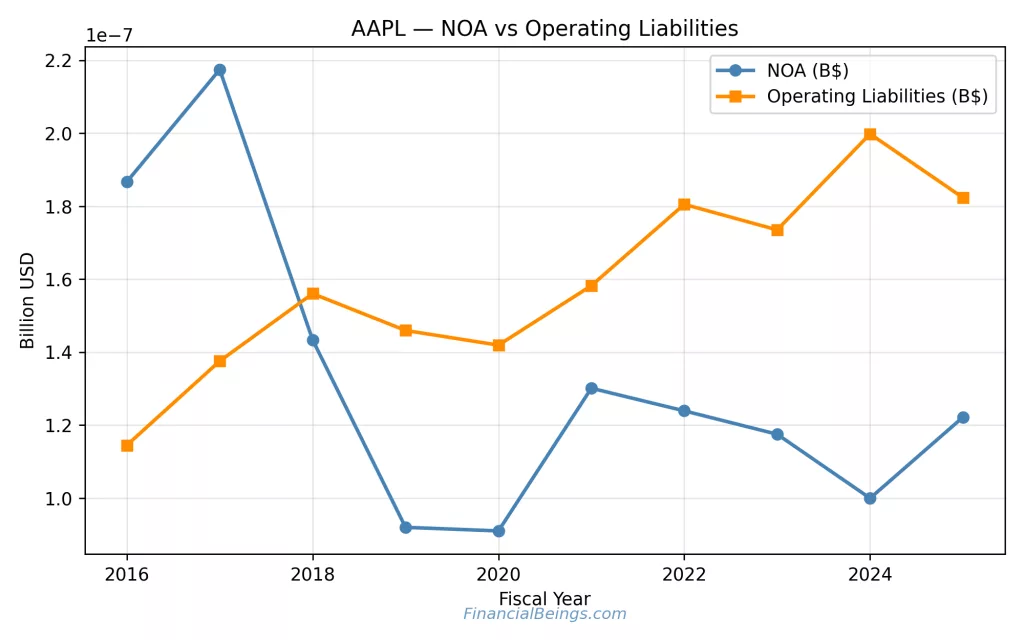
Figure 3: Apple Net Operating Assets vs Operating Liabilities
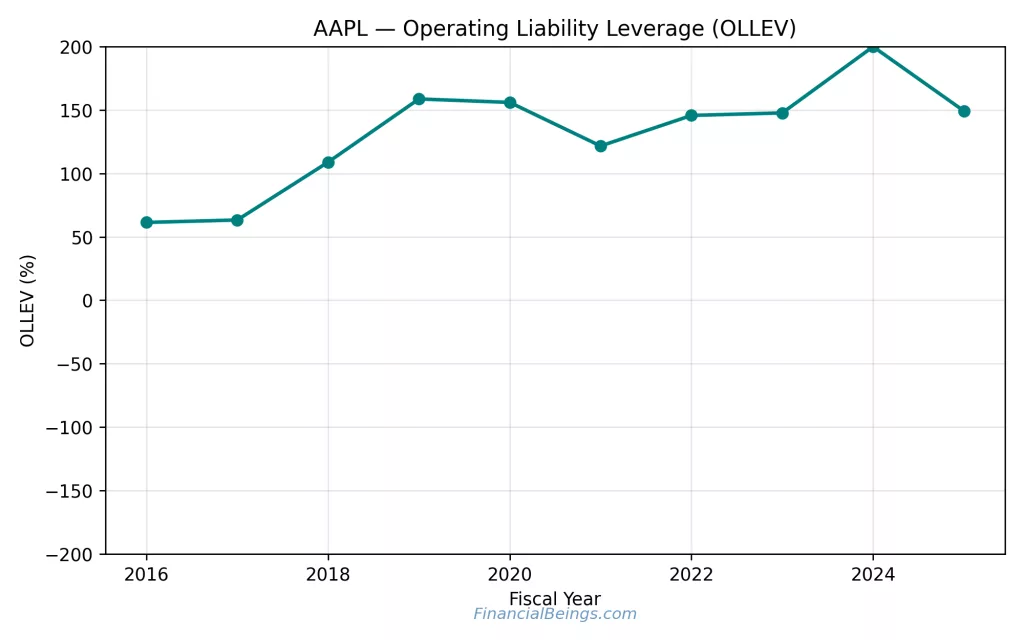
Figure 4: Apple Operating Liability Leverage (OLLEV)
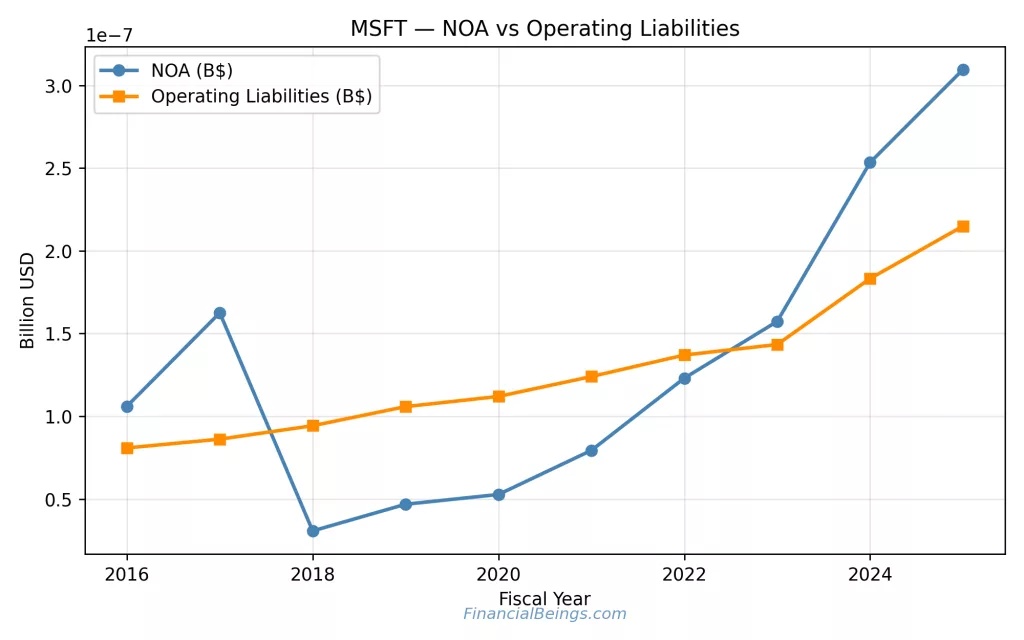
Figure 5: Microsoft Net Operating Assets vs Operating Liabilities
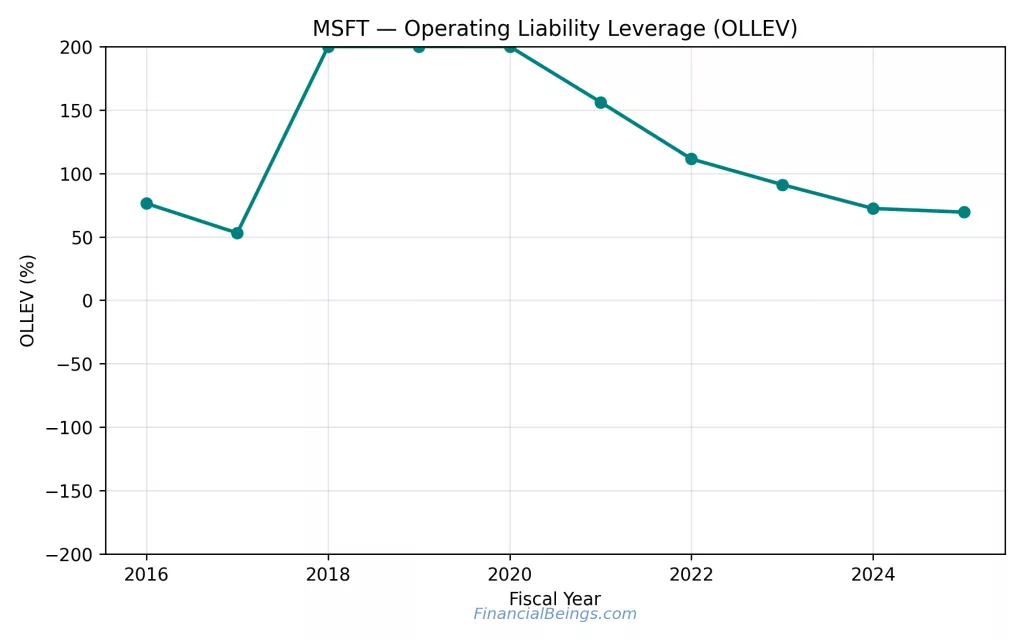
Figure 6: Microsoft Operating Liability Leverage (OLLEV)
Trending of Microsoft Operating Liability towards ~70%.
Apple or Microsoft Stock: Portfolio Recommendations
Growth
A long-term increase in upside potential due to high economic growth in profits is important to a growth-oriented investor, even if valuation risk may be greater. The intrinsic sensitivity demonstrates that both companies (Apple and Microsoft) are providing substantial upside with assumptions of growth of 7% and 8%; however, the residual earnings per share of Microsoft of approximately $10.0 versus that of Apple of approximately $7.1 in the year 2025 indicates that it creates more economic value. That tendency shows that Microsoft can be transforming its AI and cloud growth into greater economic profit per share in a more efficient manner.
Apple continues to boast strong ecosystem-based growth potential, although the growth will be pegged on consumer upgrade cycles and hardware demand. Microsoft seems to be slightly more competitive in terms of the quality of growth. For a forward-looking projection of return scenarios through 2030, see Microsoft Expected Return Analysis 2026–2030: Growth, Valuation, and Portfolio Fit Explained, which models expected firm-level returns across multiple growth paths.
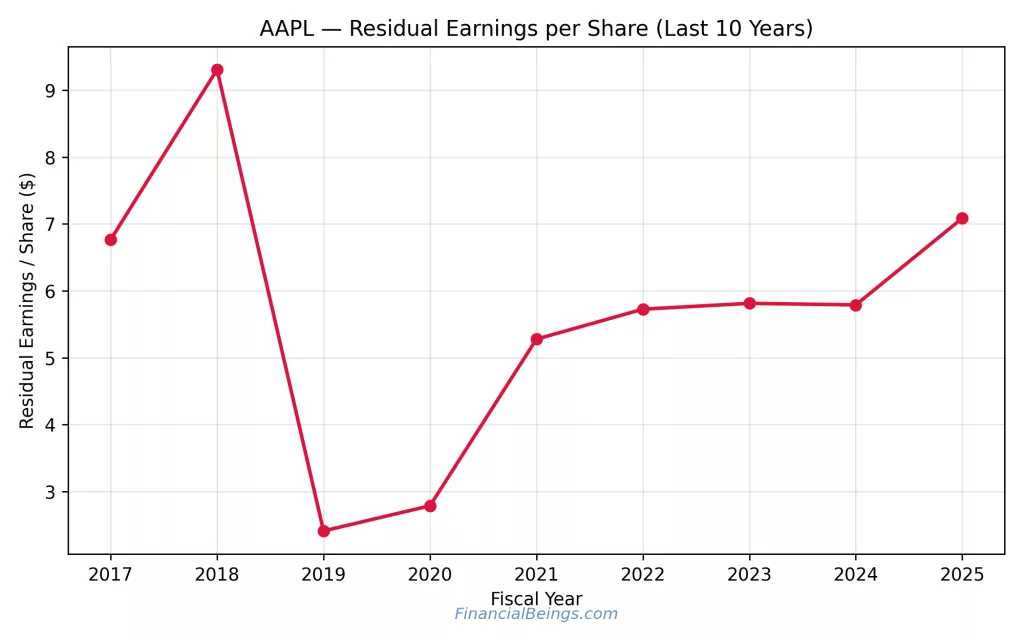
Figure 7: Apple Residual Earnings per Share (10-Year Trend)
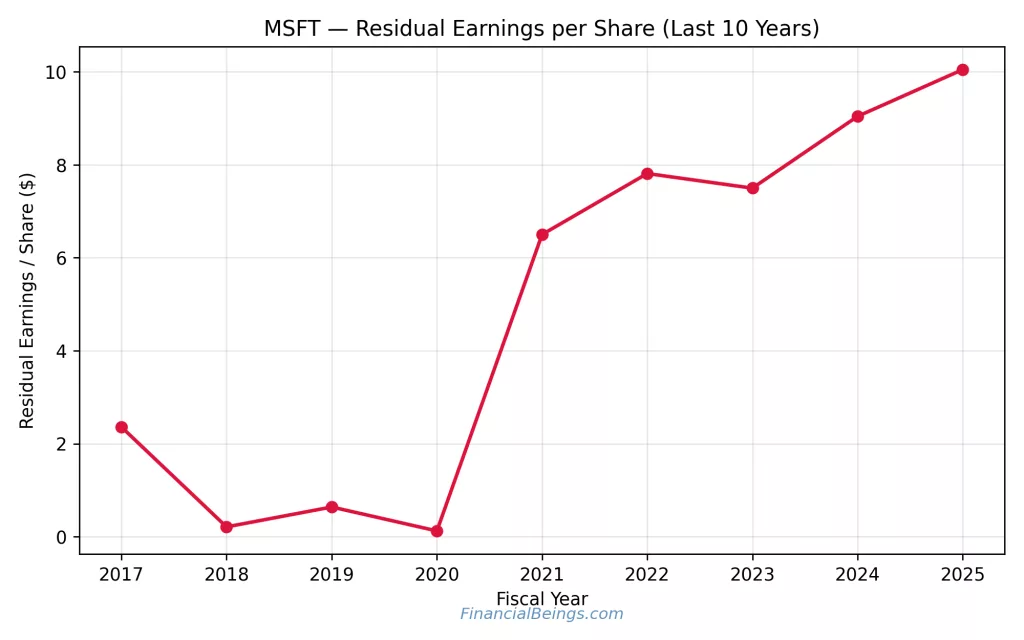
Figure 8: Microsoft Residual Earnings per Share (10-Year Trend)
Conservative
Microsoft has some strengths among conservative investors who are concerned about stability and downside protection. The yield trend of the dividend is stronger in Microsoft that offers more support in terms of income, whereas the RNOA which has stabilized at 43% in 2025 indicates efficiency in operating returns. Both of these stocks fall in the case of low-growth valuation scenarios and the trend in Microsoft and higher residual earnings could provide it with more resilience in a sluggish economic environment. Apple is financially healthy and globally diversified but its business is more sensitive to the demand cycle of consumers. On a defensive, Conservative portfolios in favor of Microsoft (Microsoft Investor Relations, 2025).
Balanced
Balanced investors will generally seek growth and stability without extreme positioning. Both companies’ merit inclusion due to the advantages of the AI development and excellent global positioning. Nevertheless, Microsoft indicates greater residual earnings per share and more dividend support in 2025, which is an indication of income and value-creation power. Apple has high potential with increased growth assumptions but seems to be more vulnerable to low growth conditions. Balanced portfolio on a risk-adjusted basis would reasonably have a slight tilt towards Microsoft due to downside safety and significant upside potential.
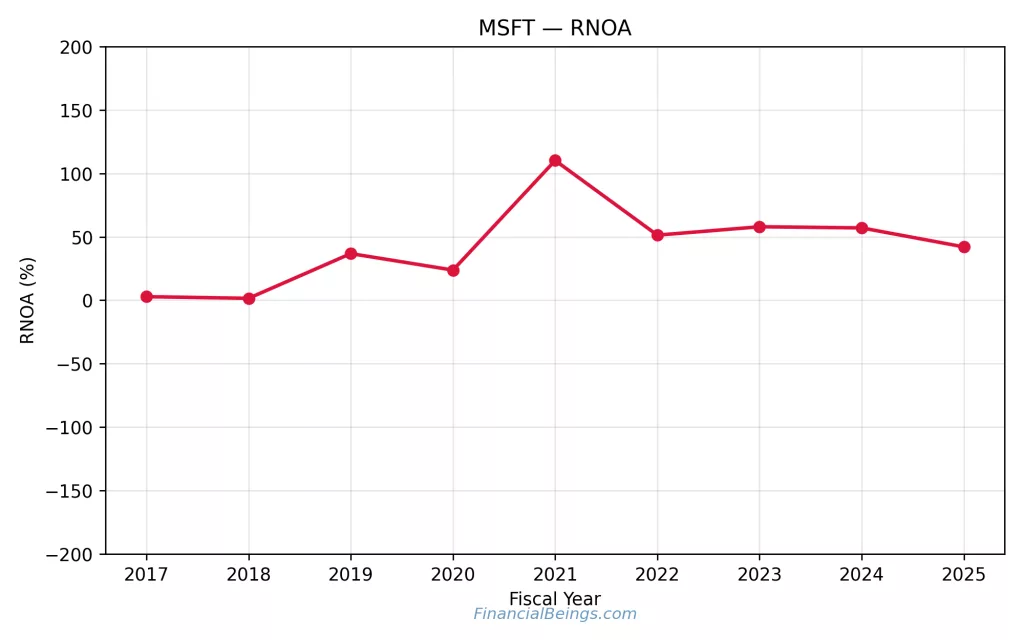
Figure 9: Microsoft Return on Net Operating Assets (RNOA)
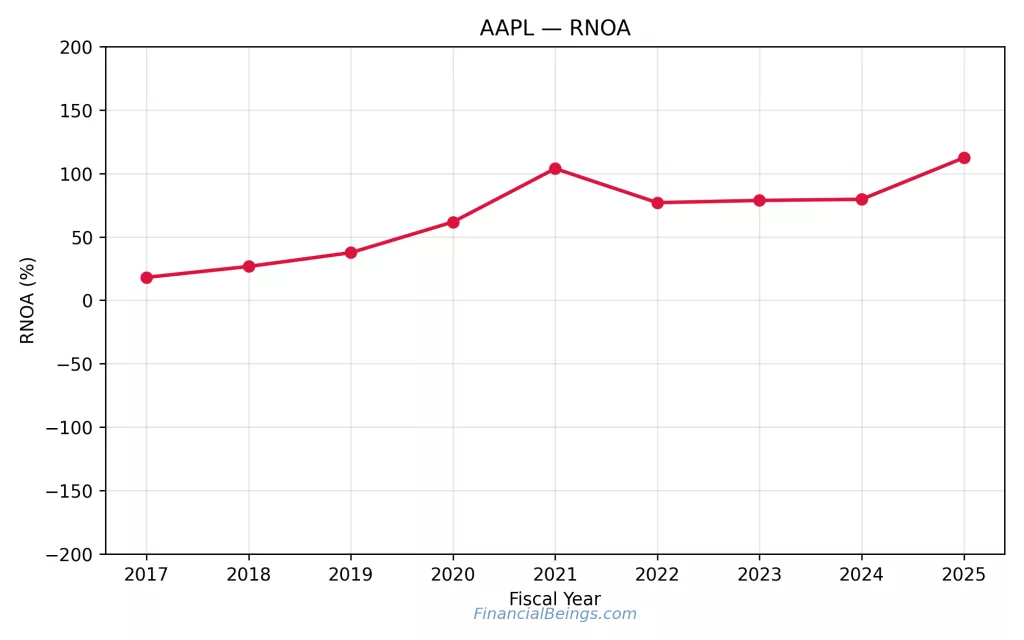
Figure 10: Apple Return on Net Operating Assets (RNOA)
Dividend Strength
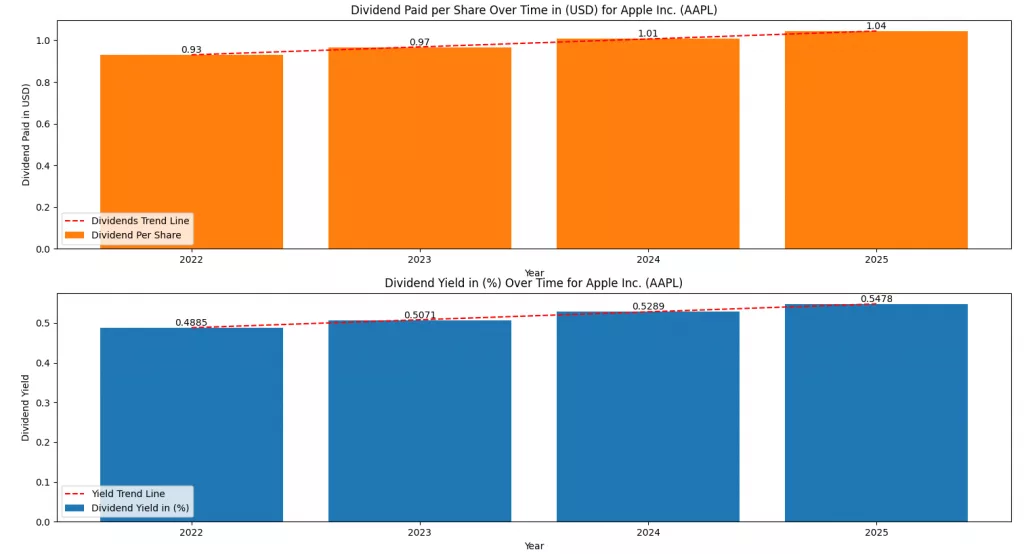
Figure 10: Apple Dividend per Share and Dividend Yield (2022–2025)
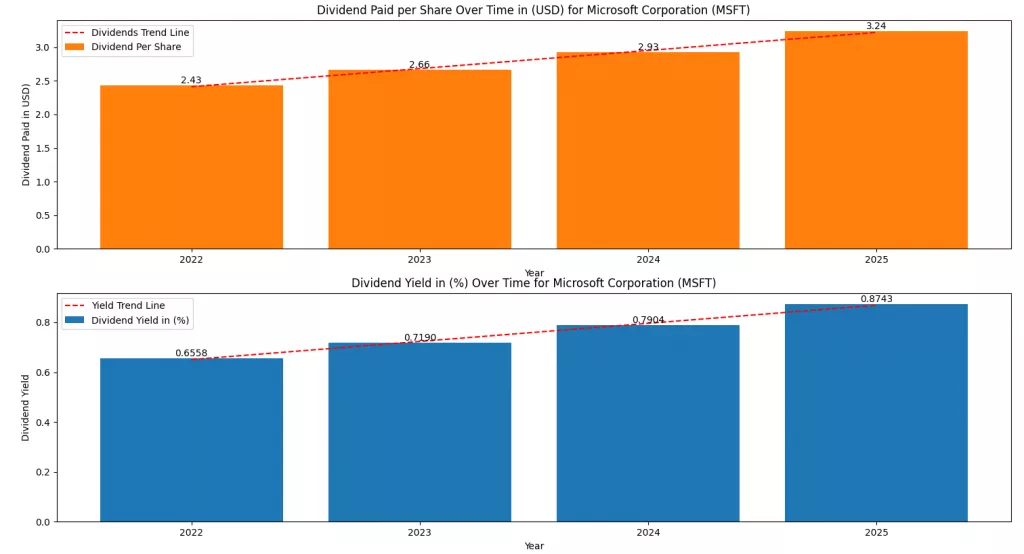
Figure 11: Microsoft Dividend per Share and Dividend Yield (2022–2025)
The dividend strength is important for two reasons. To start with, dividends offer a direct cash return. Second, dividend sustainability may be a quality signal, particularly under high valuations when investors require assurance that returns are not solely based on high price.
Table 4: Dividend Comparison (2022–2025)
| Year | AAPL Dividend | AAPL Yield | MSFT Dividend | MSFT Yield |
| 2022 | $0.93 | 0.4885% | $2.43 | 0.6558% |
| 2023 | $0.97 | 0.5071% | $2.66 | 0.7190% |
| 2024 | $1.01 | 0.5289% | $2.93 | 0.7904% |
| 2025 | $1.04 | 0.5478% | $3.24 | 0.8743% |
The trend is similar in terms of dividend per share and yield. The dividend of Apple increases gradually and is low in percentage. The yield of Microsoft’s dividend is greater, and the yield trend increases more strongly over the period presented. This is a significant difference for income-oriented investors. It is also important to total-return investors since an increase in dividends makes the company less dependent on price rises.
Final Verdict: Apple or Microsoft Stock in 2026?
The intrinsic value sensitivity reveals that neither Apple nor Microsoft are priced for low growth; both stocks can be valued to grow sustainably above the level of the GDP, and both have upside in case of high growth. The 2026 decision is thus focused on which company is in a better position to create the growth that is already implied by its market value. Apple has its strengths in its ecosystem, growth of its services, customer loyalty, and pricing power, but its performance is still more driven by the hardware upgrade cycles. Microsoft, in turn, enjoys a repeat enterprise revenue business model, a scalable cloud platform and a direct AI monetization channel.
Investors building a durable long-term allocation strategy can review Microsoft Stock for Long Term Portfolio: The Tech Powerhouse Redefining Steady Growth in 2025, which evaluates Microsoft’s structural advantages beyond short-term cycles. The increase in residual earnings per share in 2025, the additional support of dividend payments, and the lack of fluctuation of RNOA demonstrate a somewhat more advantageous risk-adjusted case of Microsoft, at the existing valuation levels. However, at current prices, both stocks seem expensive. However Microsoft offers a higher return and the intrinsic value covers a larger portion of the current market cap than Apple’s.
Usama Ali
Usama Ali is the founder of Financial Beings and a self-taught investor who blends classic valuation study with insights from psychology. Inspired by works from Benjamin Graham, Aswath Damodaran, Stephen Penman, Daniel Kahneman, and Morgan Housel, he shares independent, data-driven research to help readers connect money, mind, and happiness.
Disclaimer
The content provided herein is for informational purposes only and should not be construed as financial, investment, or other professional advice. It does not constitute a recommendation or an offer to buy or sell any financial instruments. The company accepts no responsibility for any loss or damage incurred as a result of reliance on the information provided. We strongly encourage consulting with a qualified financial advisor before making any investment decisions.