APA vs. OXY Energy Stocks: The energy industry presents itself as an embodiment of both constancy and instability. Supporters of oil and gas companies have become attractive to purchase stock, as the companies attract their attention due to their stable cash flows, and are hesitant to invest in the companies because of cyclical busts, falling and fluctuating oil prices, and increasing debt ratios. Two of the American players, APA Corporation (APA) and Occidental Petroleum Corporation (OXY), can be seen as powerful candidates in this respect. The question is: to which one should buy, APA vs. OXY Energy Stocks in 2025?
Revenue, EBITDA, and Free Cash Flow (FCF) Analysis
Profit is the lifeblood of an energy company, yet investors may have a psychologically poised concept of cash flow, which is the viable money to be employed as dividends, debt written off or buybacks.
- APA kept revenues at the same level in the range of $2.1B-2.7B during the four quarters. It is important to note that its free cash flow recovered significantly to $514M in Q3 2025 from only $306M in Q2.
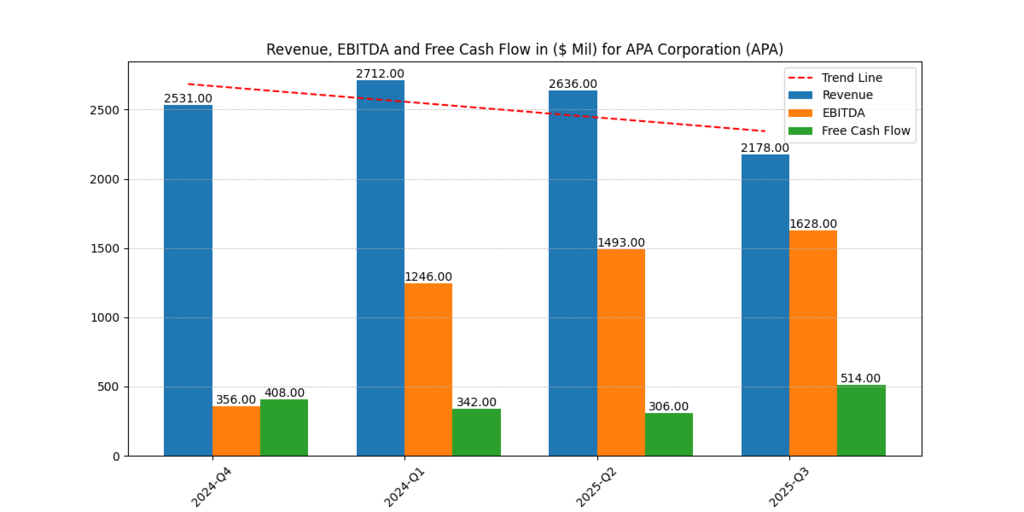
Figure 1: Quarterly Revenue, EBITDA, and Free Cash Flow for APA Corporation (2024 Q4–2025 Q3).
- Notably, OXY provided a greater absolute revenue value ($6.4-7.1B) but an inconsistent cash flow, with a significant drop, $2B in Q3 of 2024 and $962M in Q2 of 2025.
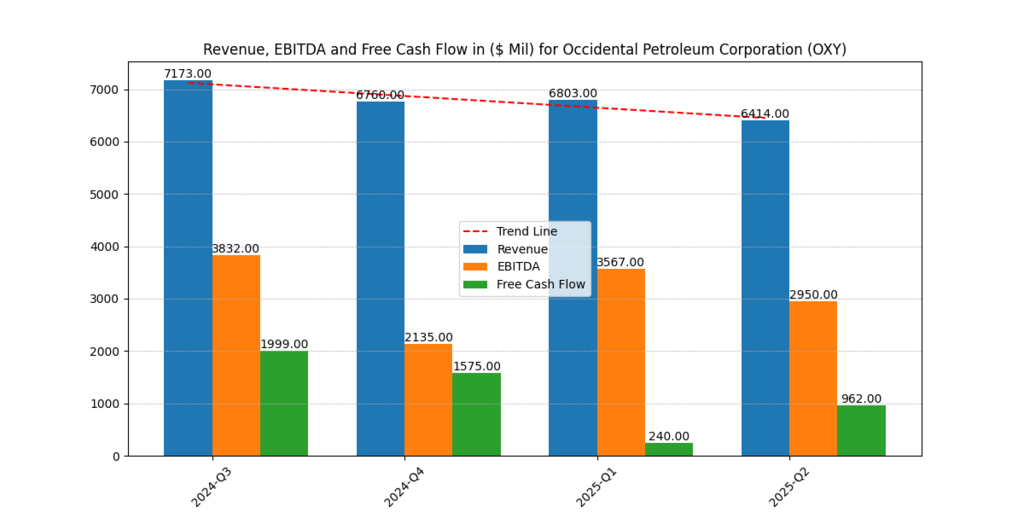
Figure 2: Quarterly Revenue, EBITDA, and Free Cash Flow for Occidental Petroleum Corporation (2024 Q3–2025 Q2).
Retail investors tend to prefer the big number (the scale of OXY), it turns out that institutional people tend to focus on the efficiency and continuity of performance, where APA is considered to be stronger.
Growth Scenarios: No Growth, 4%, and 6%
Here is a simplified growth-rate comparison:
| Growth Rate | APA 2025E Price per Share (USD) | OXY 2025E Price per Share (USD) |
| No Growth | $12.42 | $37.79 |
| +4% Growth | $38.70 | $42.78 |
| +6% Growth | $41.20 | $47.53 |
In comparison with APA vs. OXY Energy Stocks, as OXY continues to have a higher earnings base than APA, a low percentage growth sensitivity is seen. This makes APA appealing to growth-oriented investors who psychologically pursue outlier upside potential.
In comparison with APA vs. OXY Energy Stocks, as OXY continues to have a higher earnings base than APA, a low percentage growth sensitivity is seen. This makes APA appealing to growth-oriented investors who psychologically pursue outlier upside potential.
Return on Equity (ROE) and Return on Capital (ROTC)
Profitability ratios are important because they show how effectively management converts equity and assets into earnings.
- APA: ROE increased from -4.36% in Q4 2024 to 10.21% by Q3 2025. TTM ROE is at almost 19% and ROTC is at nearly 19.5%.
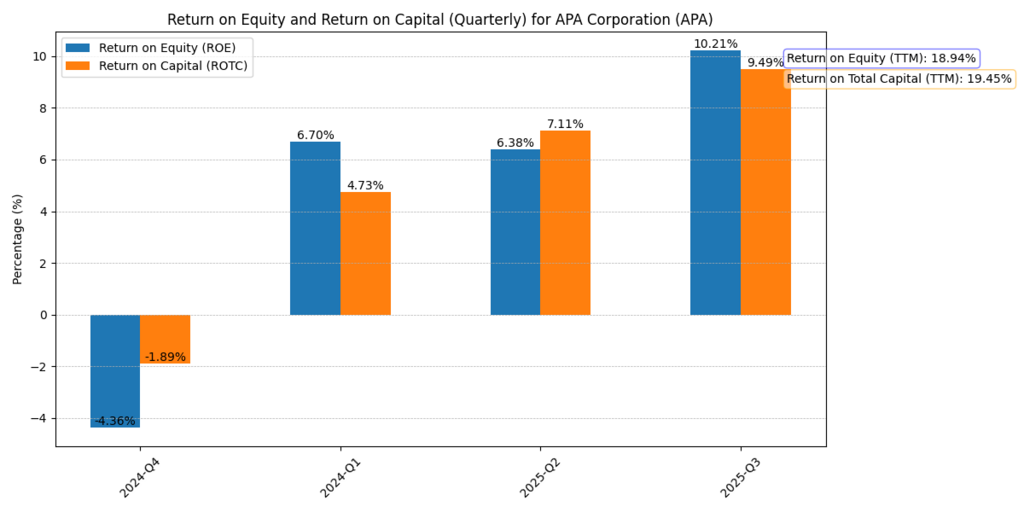
Figure 3: Return on Equity (ROE) and Return on Capital (ROTC) for APA Corporation, showing strong recovery through 2025.
- OXY: Averaging between 1% and 3% per quarter, ROE performance was behind TTM at 6.3% and ROTC at 7.7%.
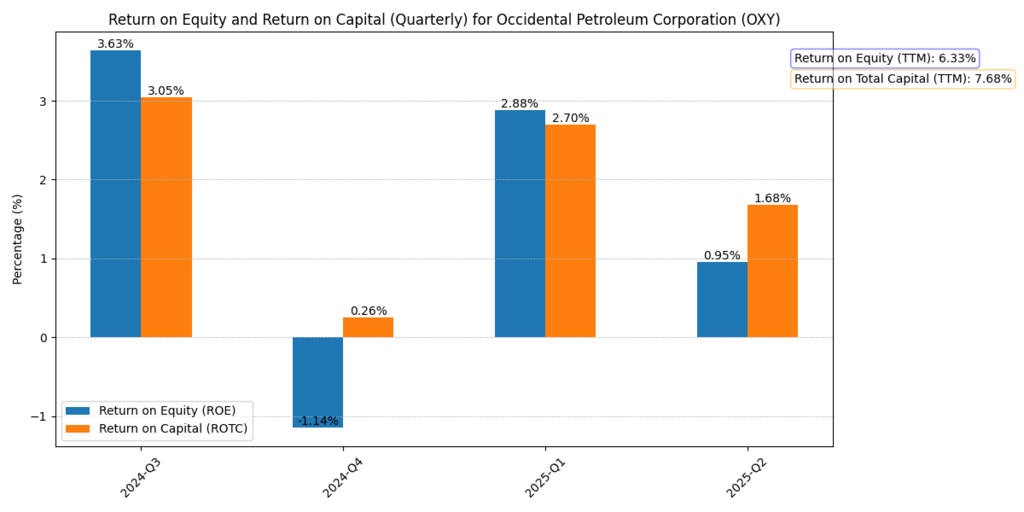
Figure 4: Return on Equity (ROE) and Return on Capital (ROTC) for Occidental Petroleum Corporation, highlighting weaker efficiency ratios.
High ROE draws confidence-driven investors and momentum traders who seek reassurance that management can produce higher returns (Penman, 2021). APA is obviously dominant here.
Balance Sheet Strength: Assets to Liabilities
In the energy sector, where debt financing and capital intensity predominate, the assets-to-liabilities ratio is crucial.
- The APA showed steady strengthening, rising from 1.47 in Q4 2024 to 1.62 in Q3 2025.
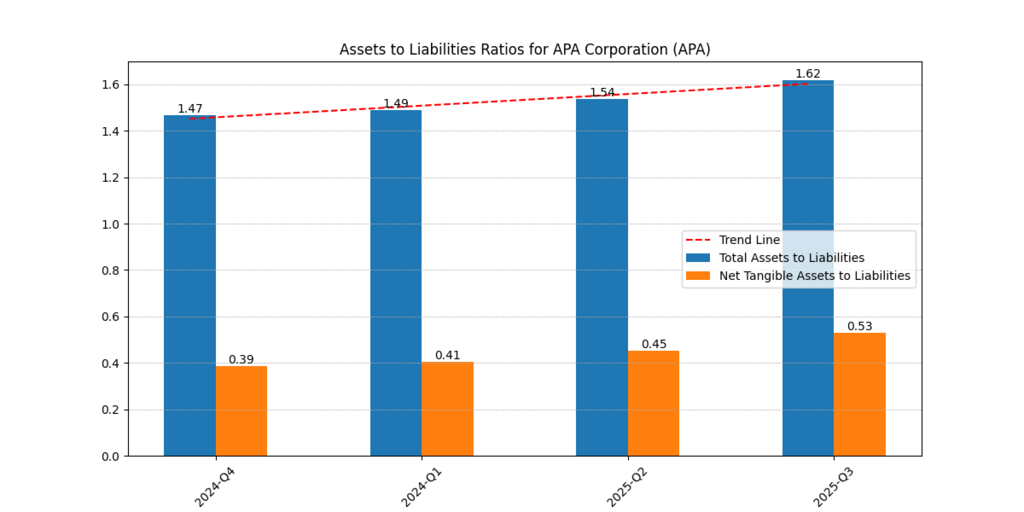
Figure 5: Assets-to-Liabilities Ratios for APA Corporation, showing gradual balance sheet strengthening.
- OXY remained higher (1.68–1.75), although it has a greater debt load due to its reliance on physical assets.
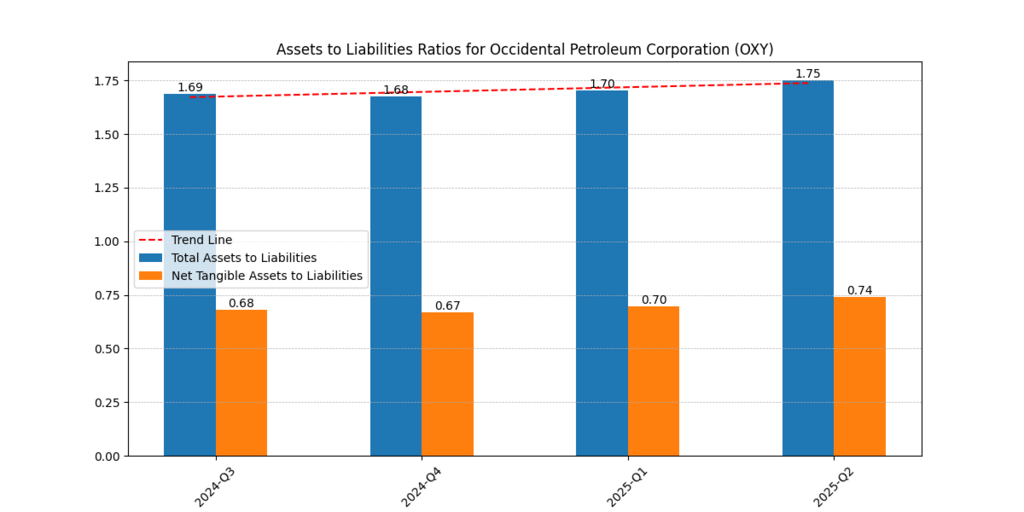
Figure 6: Assets-to-Liabilities Ratios for Occidental Petroleum Corporation, showing a relatively stronger but more debt-leveraged balance sheet.
While conservative investors might view OXY’s asset leverage as a possible upside amplifier, cautious investors frequently choose firms exhibiting stable strengthening (APA).
Debt Ratios and Coverage
During recessions, survival is frequently determined by the sustainability of debt.
- The debt profile of APA is getting better. While coverage ratios increased (EBITDA coverage reaching 23.26 in Q3 2025), total debt/EBITDA decreased from 18.17 in Q4 2024 to just 2.86 in Q3 2025.
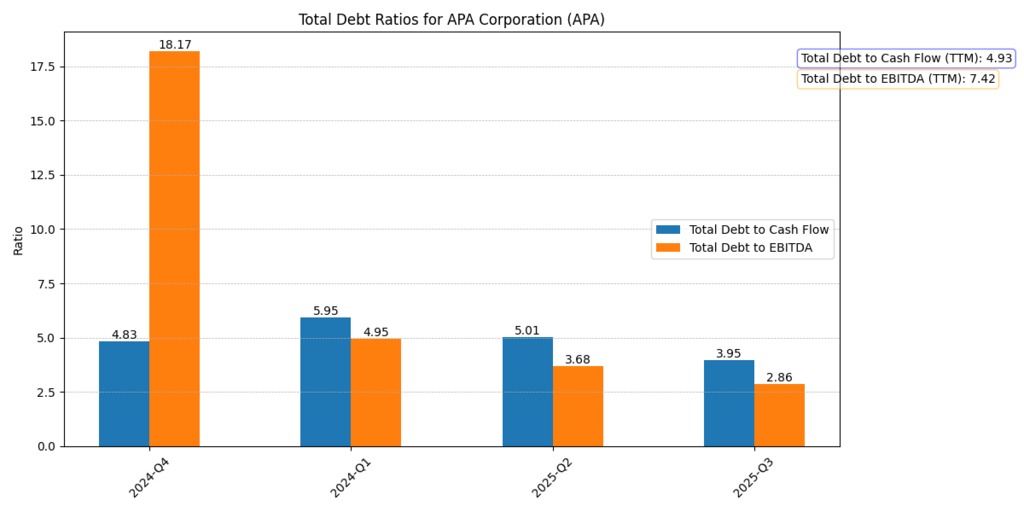
Figure 7: Debt Ratios (Debt/EBITDA and Debt/Cash Flow) for APA Corporation, showing a sharp improvement in leverage management.
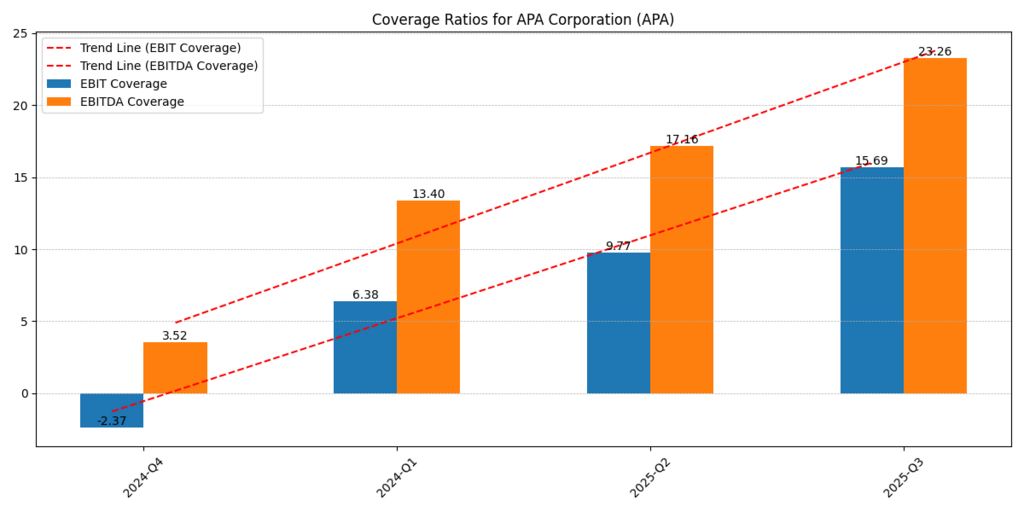
Figure 8: Coverage Ratios for APA Corporation, with a strong upward trend in EBIT and EBITDA coverage by 2025.
- OXY, however, the Total Debt/EBITDA ratio of around 8.85 (TTM) indicates that it is still highly leveraged. An early warning flag for investors is the decline in coverage ratios.
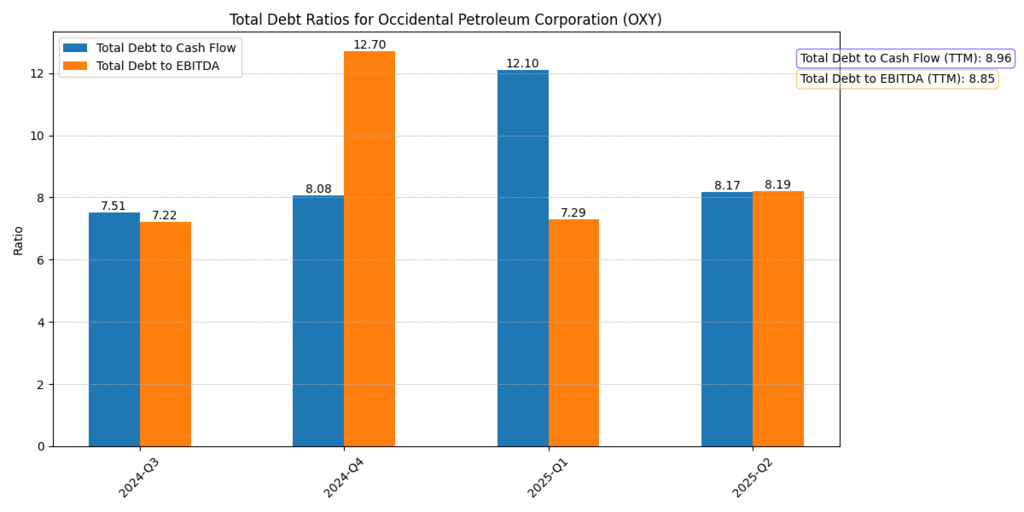
Figure 9: Debt Ratios (Debt/EBITDA and Debt/Cash Flow) for Occidental Petroleum Corporation, highlighting sustained leverage risks.
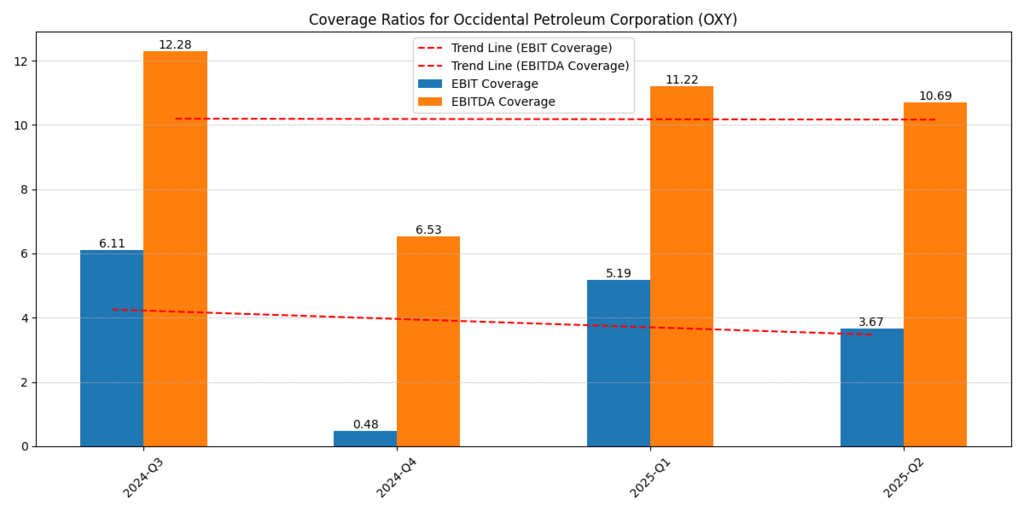
Figure 10: Coverage Ratios for Occidental Petroleum Corporation, indicating weakening ability to cover interest obligations.
Downside protection is a top priority for risk-averse investors. While OXY might draw high-risk traders who associate leverage with greater potential returns, APA’s declining leverage reassures them (Damodaran, 2023).
Operational Efficiency
In a setting where commodities are fluctuating, margins demonstrate management’s control over expenses.
- APA: Net margins increased from –8.81% to 27.69% a turnaround story, while gross margins decreased from 43.6% in Q4 2024 to about 40% in Q3 2025.
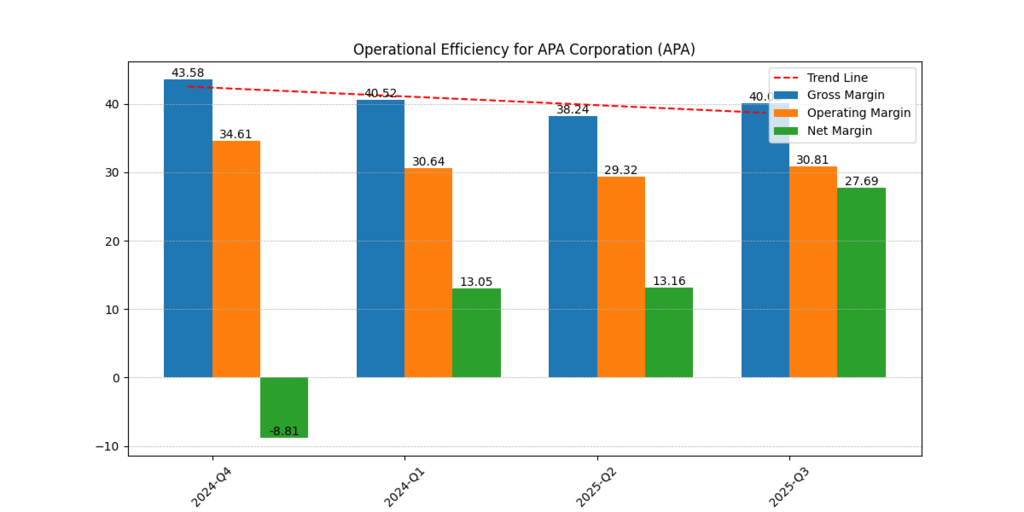
Figure 11: Operational Efficiency Ratios for APA Corporation, highlighting margin recovery and net margin expansion.
- OXY: Net margins plummeted from 13% to just 4%, while gross margins continuously decreased from 38% to 32%.
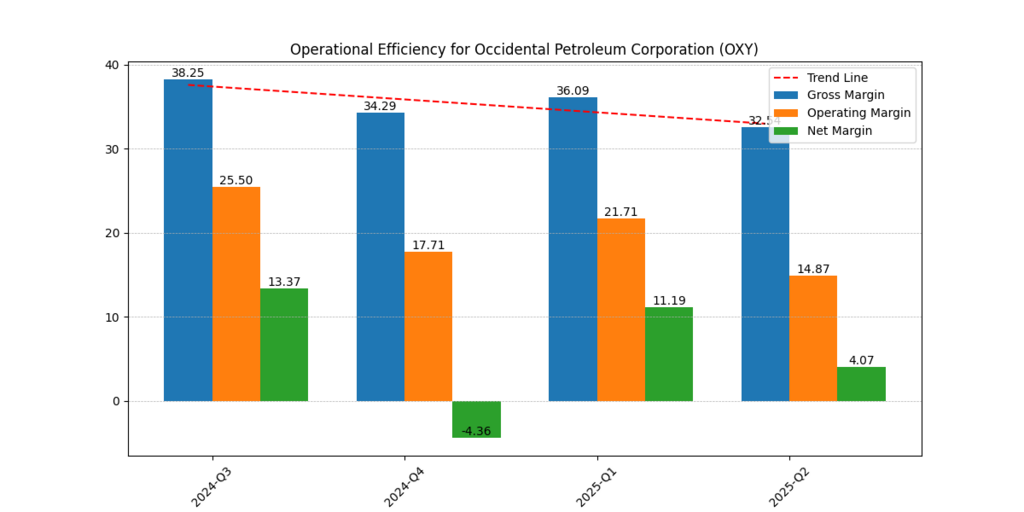
Figure 12: Operational Efficiency Ratios for Occidental Petroleum Corporation, showing steady margin decline.
Narratives of turnaround are valued by investors. Because of the momentum created by APA’s margin increase, traders pursuing increasing fundamentals may engage in herd mentality (Kahneman & Tversky, 2013).
Further Reading : The 3 Good Oil Stocks to Buy for Your Portfolio
Comparative Table: Key Metrics
| Metric (2025 Q3) | APA | OXY |
| Revenue ($ Mil) | 2,178 | 6,414 |
| Free Cash Flow ($ Mil) | 514 | 962 |
| ROE (TTM) | 18.94% | 6.33% |
| ROTC (TTM) | 19.45% | 7.68% |
| Debt/EBITDA (TTM) | 7.42 → 2.86 improving | ~8.85 |
| Assets/Liabilities | 1.62 | 1.75 |
| Net Margin (%) | 27.69 | 4.07 |
Investor Psychology and Market Behaviour
Knowing why investors select a particular company over another is frequently just as important as the actual numbers.
- Anchoring Bias: Many investors view OXY as “safer” because of its greater scale and bigger revenues.
- Recency Bias: Investors who place a premium on recent performance are drawn to APA’s notable rebound in free cash flow and margins.
- Risk Appetite: OXY entices high-beta investors who are counting on rises in the price of oil, whereas APA draws cautious yet growth-seeking investors.
As noted by Kahneman & Tversky (2013), Decision-making under uncertainty is rarely logical, with bias and emotion having a significant impact on results.
Conclusion: APA vs. OXY Energy Stocks in 2025?
Both APA and OXY Energy Stocks make strong but different arguments when compared:
- APA offers leaner operations, better coverage ratios, increased ROE, and net margin expansion. For investors who value stability with growth, it is a high-efficiency turnaround bet.
- OXY, despite being larger, has higher debt and exhibits margin compression. Only when oil prices rise sharply does it continue to be appealing to investors who are prepared to take on greater risk.
Between APA and OXY Energy Stocks, the former proves to be a better option in the minds of the majority of investors in 2025. APA promises long-term holder security and certainty of enhanced returns, healthy debt coverage and strong cash flows. OXY, however, is a more speculative choice; its greater scale and upward mobility are constrained by intense leverage and margin squeeze, an ambitious bet that best suits risk-seekers.
Disclaimer
The content provided herein is for informational purposes only and should not be construed as financial, investment, or other professional advice. It does not constitute a recommendation or an offer to buy or sell any financial instruments. The company accepts no responsibility for any loss or damage incurred as a result of reliance on the information provided. We strongly encourage consulting with a qualified financial advisor before making any investment decisions.