Microsoft (MSFT) stock After Q1 2026 Stock- Find out why AI and cloud development are creating the long-term valuation of MSFT. Assess the revenue trend, margin growth, and profitability drivers to determine whether Microsoft remains a good investment.
Microsoft’s Q1 2026 Earnings Snapshot
Overview of revenue, EPS, and YoY performance
MSFT Stock After Q1 2026 is an assessment of a company that will be reinventing its value propositions on enterprise solutions that AI powers. In its Q1 2026 fiscal-year report, Microsoft indicated robust growth across all business segments, with double-digit growth and a payback to shareholders in the form of dividends and share buybacks amounting to US$10.7 billion (Microsoft Corporation, 2025a).
Segment results: Productivity & Business Processes, Intelligent Cloud, More Personal Computing
| Segment | Q1 FY 26 Revenue (US$ $m) | Q1 FY 25 Revenue (US$ $m) | Growth % |
| Productivity & Business Processes | 33,020 | 28,317 | +17 |
| Intelligent Cloud | 30,897 | 24,092 | +28 |
| More Personal Computing | 13,756 | 13,176 | +4 |
(Source: Microsoft Corporation, 2025b.)
AI Integration: Copilot, Azure OpenAI, and Enterprise Demand
How strong is Azure growth in 2026? The Copilot and Azure OpenAI services that Microsoft has incorporated into its product system can be used to explain how AI is becoming a core of revenue and productivity. By introducing intelligent assistants across Office 365, Teams, and Dynamics, Microsoft can help enterprises improve workflow processing, decision-making, and efficiency. This growing business makes Microsoft Q1 2026 earnings analysis a good beneficiary of the global revolution into AI-driven business processes.
Market reaction and stock performance post-earnings
Its total quarterly revenue was US $77.7 billion, and its earnings per share amounted to US $4.13. The investors interpreted these performances in AI and cloud, yet the post-earnings share price reaction was modest due to already high expectations. This, as far as behavioural finance is concerned, raises the question of how anchoring and confirmation bias affect MSFT Stock valuation 2026 – good news tends to be priced in before it happens (Kahneman & Tversky, 2011).
AI and Cloud Expansion as Core Growth Engines
Azure growth trajectory and enterprise adoption
At Microsoft, the primary force of growth is Azure. Intelligent Cloud segment also increased by US $30.9 billion to the US $24.1 billion year on year (Microsoft Corporation, 2025b). According to Morningstar (2025), momentum and hybrid-cloud capabilities of Azure is one of the reasons that carry high premium valuation multiple of Microsoft.
Integration of AI copilots across the Microsoft ecosystem
With the launch of Microsoft Copilot revenue contribution across Office 365, Teams, and Dynamics, productivity software is now an AI-assisted ecosystem. According to analysts, AI contribution can grow to 5 -8 per cent of the increase in revenues over the next three years to support the long-term earnings (Seeking Alpha, 2025). Hence, Microsoft cloud and AI growth are the two elements of MSFT long-term growth outlook and the justification for the investment thesis of MSFT Stock after Q1 2026.
Cloud competition vs AWS and Google Cloud
AWS still retains a bigger market share, but Microsoft has so far narrowed the margin with the help of enterprise relationships and the benefits of hybrid deployment (Morningstar, 2025). Google Cloud has been trailing in profitability but is performing well in AI research. It is a three-way competitive battle that defines Microsoft vs. Amazon cloud dominance and shapes market sentiment. Microsoft capital efficiency and returns have exceeded US$30 billion in Q1 FY 26 on data-centre and AI infrastructure, according to The Motley Fool (2025), which are signs of a strategic position in the long term rather than short-term margin optimisation.
Link between AI expansion and sustainable RNOA
One opportunity to stabilise RNOA is to use artificial intelligence to enhance operational efficiency. The RNOA’s settling value is 27 per cent in 2025, and it has experienced many spikes in the past. AI automates the sales and financial functions of the organisation, ensuring returns on net operating assets over a period, owing to the cost discipline and process innovation (Penman & Yehuda, 2019). Then, MSFT Stock After Q1 2026 will illustrate how AI growth underscores the importance of consistent profitability over headline news.
Financial Foundation — Margins, Cash Flow, and Capital Efficiency
Operating and net margin trends post-Q1 2026
AI and cloud profitability at Microsoft on the elite level: the gross margin is approximately 68-69%, the operating margin is approximately 45%, and the net margin is approximately 36%. These values reflect the slight compression in FY 25. Microsoft has strategically priced its AI-enhanced cloud services to offset the ever-rising costs of compute and energy (Microsoft Corporation, 2025a). MSFT cash flow and margins 2026 will remain part of the competitive advantage and the reason Microsoft profitability forecast values will be at the centre of analyst valuation (Investing.com, 2025).
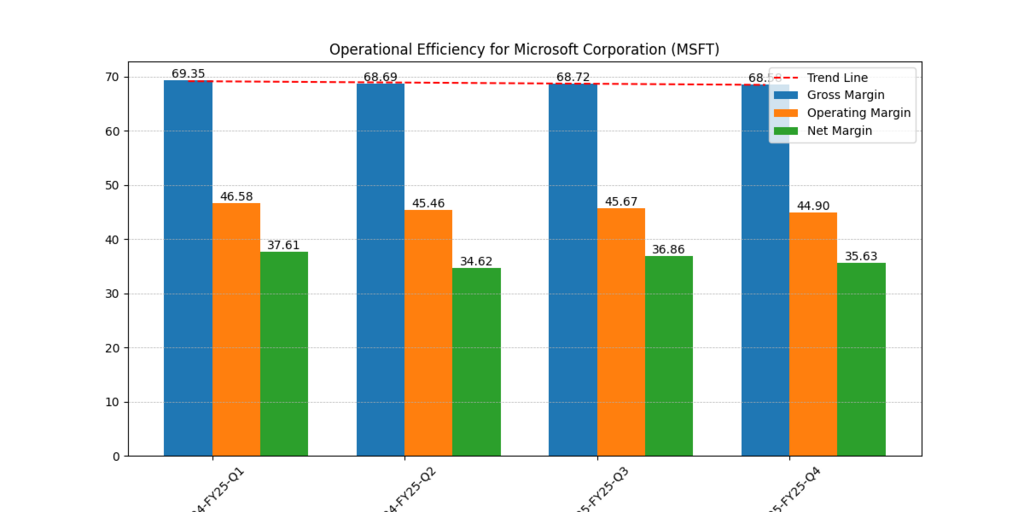
Figure 1: MSFT Gross, Operating, and Net Margin Trends (FY, 2025)
Free cash flow generation and reinvestment efficiency
The value of Free Cash Flow (FCF) is enormous, standing at US $ 25.6 billion in Q4 FY 25, after slightly dropping to US $ 6.5 billion in Q2. The stability of Microsoft’s cash conversion cycle is evidenced by consistent recovery in the following quarters (Kahneman & Tversky, 2011).
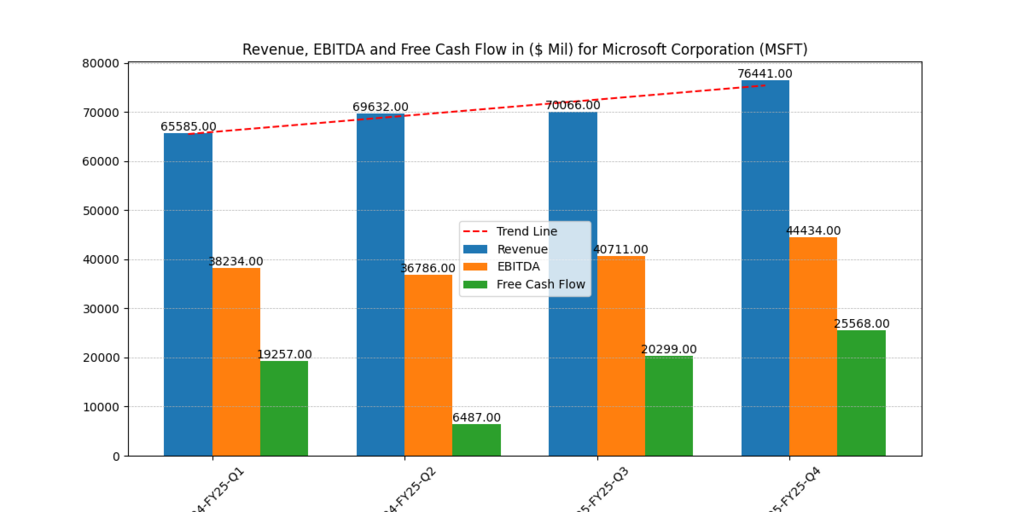
Figure 2: Microsoft Quarterly Revenue, EBITDA, and Free Cash Flow (FY, 2025).
OLLEV and Microsoft’s conservative balance-sheet strength
A moderate OLLEV ratio is achieved when Operating Assets increase at a constant rate and Operating Liabilities (OL) remain steady. The assets and liabilities balance sheet in the form of assets and liabilities.png also shows an existing 2.25x Assets-to-Liabilities ratio and a 0.73x Net Tangible Assets-to-Liabilities ratio, both indicators of financial strength (Microsoft Corporation, 2025a). All these numbers highlight Microsoft valuation vs peers (AWS, Google Cloud) in the technology industry.
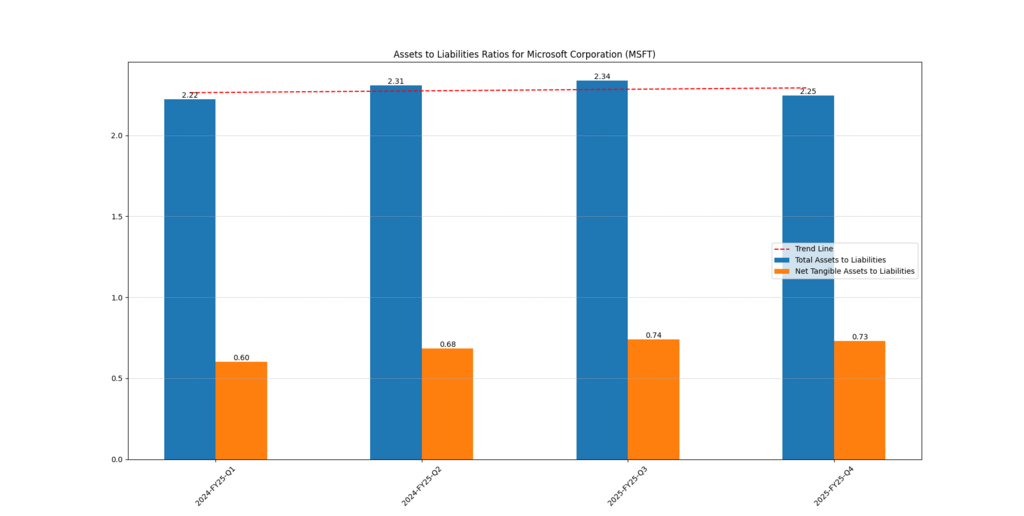
Figure 3: Microsoft Assets-to-Liabilities and Net Tangible Assets Ratios (FY 2025).
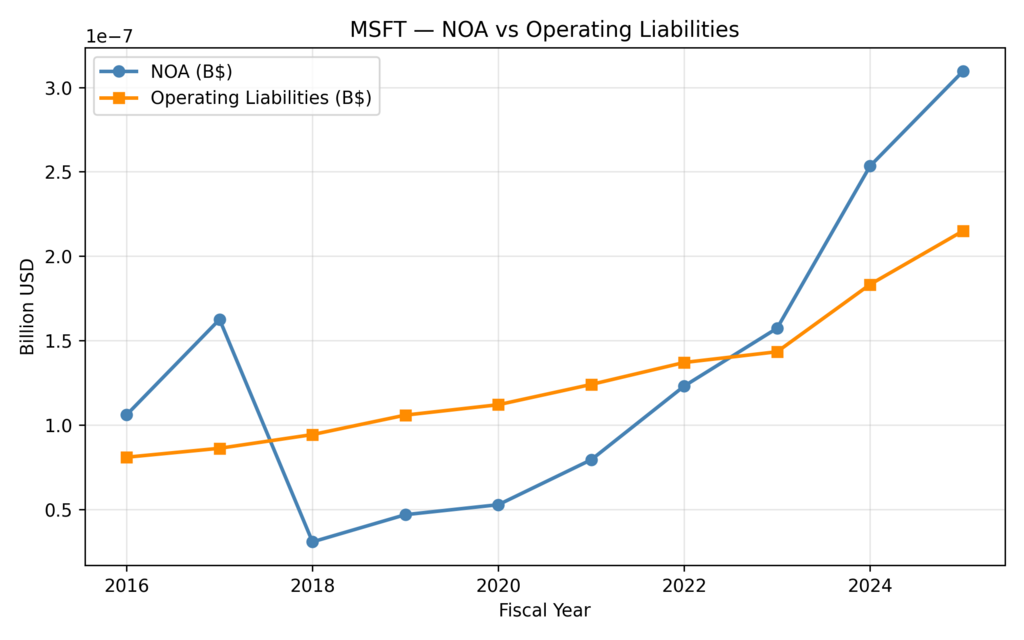
Figure 4: Net Operating Assets and Operating Liabilities (FY, 2025).
RNOA and Residual Operating Income (ReOI) trajectory
The Residual Earnings per Share of approximately US$14 and the RNOA of approximately 27 per cent indicate that, even now, Microsoft has a high return on incremental capital, which is well above its cost of capital (Jiang, 2023). This validates the view that MSFT Stock After Q1 2026 is sustainable in terms of compounding, even as headline growth levels off.
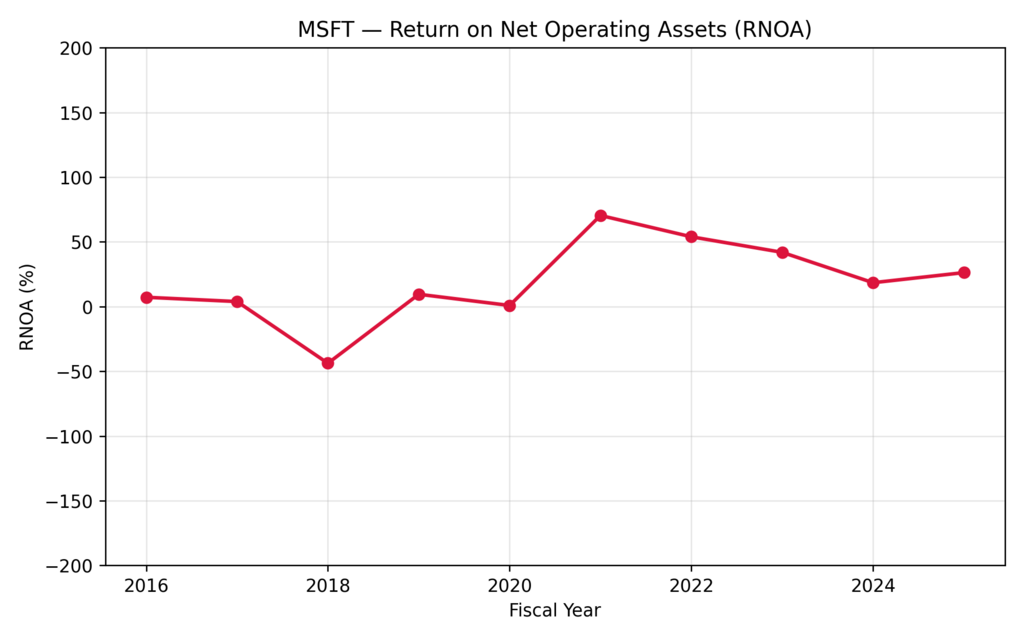
Figure 5: Microsoft Return on Net Operating Assets (RNOA) 2016–2025.
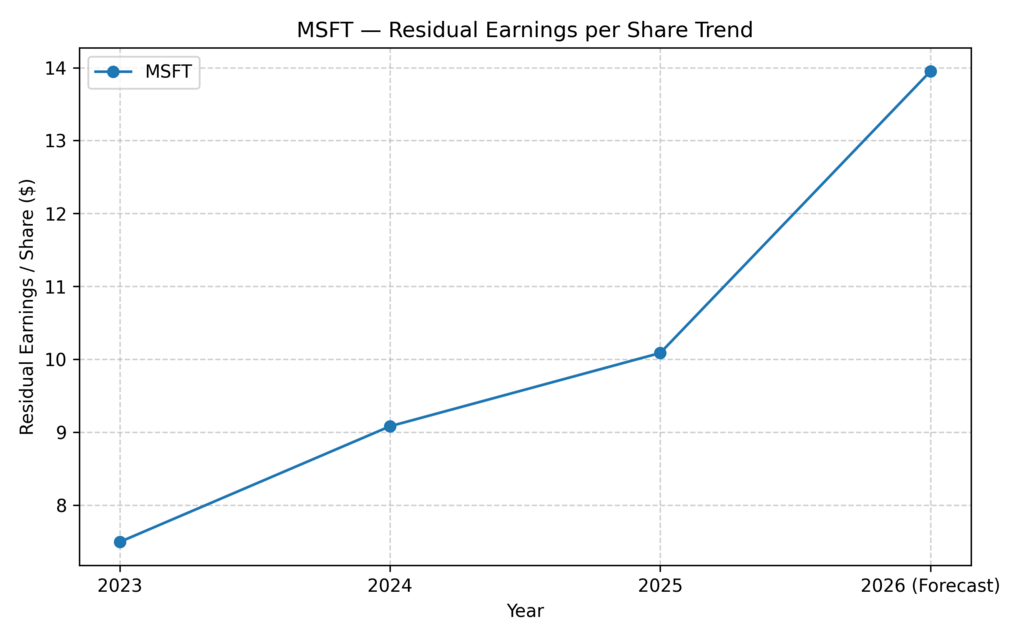
Figure 6: Residual Earnings per Share Growth (2023–2026).
Valuation Perspective — What’s Priced into MSFT Today
Market cap, valuation multiples, and implied growth
The market capitalisation of Microsoft and its P/E ratio are trading well above their historical means. Morningstar (2025) estimates the company’s fair value at approximately US$600 per share, indicating that investors are placing greater value on AI leadership. However, under the residual income valuation model, the MSFT intrinsic value analysis may be significantly reduced by even slight changes in the projected growth rate (g) or by increases in the cost of capital (r) (Penman & Yehuda, 2019). Thus, the error margin is low regarding MSFT Stock after Q1 2026.
Comparison with long-term intrinsic value range
Microsoft could have found that its intrinsic value was slightly underpriced relative to the market, driven by the steady quality of earnings and the value still in existence. The Residual Operating Income (ReOI) is indicative of this conclusion – steady year-over-year growth attests to the retention of good earnings and the attractiveness of using your capital. Recently we have analysed MSFT and AAPL where we provide investors with detailed reasoning on which one should they buy in 2026.
Sensitivity analysis: growth rate vs cost of capital
The premium of Microsoft on the EV/EBITDA and P/FCF bases is compared with AWS and Google Cloud (MarketBeat, 2025). However, such a premium can be justified by its high margin and capital base. The Microsoft ReOI and RNOA performance have been twice those of Alphabet and Amazon Web Services, which is sufficient to demonstrate that the market valuation is based on actual performance differentiation rather than hype.
Economic Profitability
Microsoft stock forecast for investors, the hybrid residual income model offered by Penman, is a more precise evaluation of intrinsic value (Penman & Yehuda, 2019). According to residual earnings data for FY 33 to 26 (that is, rising to US$14 per share), the model reveals that a larger fraction of Microsoft’s long-term economic profit is already embedded in its market value. This confirms that the MSFT Stock After Q1 2026 is trading at its intrinsic value, as evident by high-quality earnings and effective capital utilisation (Jiang, 2023).
Long-Term Profitability Drivers and Risks
Core moat from AI, cloud, and enterprise software dominance
Microsoft has an enterprise ecosystem on which its moat is founded; the set of software lock-in, cloud integration and AI-as-a-service services (Microsoft Corporation, 2025a). This ecosystem creates switching costs, which allow it to survive returns in the face of price pressure. The trend pattern of Microsoft AI-driven revenue trends indicates that Copilot subscriptions and AI inference services will monetize without the cost involved in getting new customers.
Margin compression risks from AI infrastructure costs
AI workloads are very powerful but expensive to scale on servers and incur high energy costss. The management has realised that AI infrastructure costs can temporarily squeegee the gross margins (The Motley Fool, 2025). Thus, investors should monitor the equilibrium between unit-cost control and top-line growth. The current decline in margins can affect MSFT’s profitability forecast after FY 26.
Competitive threats and regulatory environment
AI partnerships and cloud dominance are still under scrutiny by global regulators (Reuters, 2025). Despite Microsoft’s admirable track record of compliance, the antitrust risks are long-term valuation headwinds. Simultaneously, the pace of AI offerings from AWS and Google Cloud is growing, meaning they compete over a larger share of enterprise wallets than ever before, and investors should consider this when evaluating MSFT implied growth rate analysis.
Long-run growth fade and terminal profitability outlook
Economic theory holds that excess returns in old-age industries would converge to the cost of capital. This means that the present 27 per cent RNOA would be reduced to 15-18 per cent in the long run in the Microsoft case. Nevertheless, it should have the capacity to sustain growth in residual income even in the terminal stage, which will underpin Microsoft long-term stock outlook 2025-2030.
Investment Outlook — Is Microsoft Still a Buy After Q1 2026?
Comparison of Intrinsic vs Market-Implied Valuation
The comparative analysis of Microsoft’s intrinsic value, calculated using the hybrid residual income model (Penman & Yehuda, 2019), shows that the book value and residual earnings growth are close to the company’s current market capitalisation. What is promising is that your graph shows that the growth in residual earnings per share of US$7.5 to approximately US$14 in 2023 and 2026, respectively, seems to suggest that Microsoft’s economic profit continues to expand, but much of the profit has already been reflected by the investors. The fair value of Microsoft at Morningstar (2025) is near US$600 per share, implying that MSFT Stock After Q1 2026 would be in the justified premium zone rather than a deep discount.
Further Reading : MSFT vs Amazon AWS Cloud Growth After Q3-2025: Which Tech Giant Will Dominate?
Further Reading : Why to Buy Microsoft Stock in 2025? Strong Earnings, AI Growth & Dividends!
Long-Term Growth vs Short-Term Volatility
Microsoft’s long-term growth story remains intact, driven by its leadership in AI, cloud, and enterprise software ecosystems. Historically, Microsoft’s RNOA stability (~27 %) and high free cash flow conversion have cushioned downturns. Thus, while temporary market pullbacks could occur, the company’s long-term trajectory toward steady compounding growth remains firmly supported by its underlying financial strength (Microsoft Corporation, 2025a).
Return Expectations for 2026–2030 Investors
Realistic returns in the long-term outlook, where investors plan to invest in Microsoft in 2030, would focus on how Microsoft can ensure high-quality returns and foresight-driven reinvestment. MSFT price target 2026–2027 may be 9-10 per cent per annum, in line with the company’s cost of equity. In this respect, MSFT Stock After Q1 2026 is the most appealing option for investors who want to identify themselves as financially resilient and focused on sustainable value creation rather than as value-creation speculators.
Final Verdict: Sustainable Compounding or Overvaluation Risk
Is Microsoft stock a buy after Q1 2026? Microsoft is a sustainable compounding business rather than a highly valued speculative investment. It is well worth valuing because it has strong fundamentals, high margins, and stable free cash flow, driven by sustainable AI. The low buffer, however, shows that Azure and Copilot financial impact or any rise in the price of AI infrastructure will mean a squashing of valuation. Therefore, the long-term, high-quality investment that will reward patience and discipline is MSFT Stock after Q1 2026. Microsoft earnings report 2026 highlights predictability and compounding capabilities to investors, unlike short-term returns that can be explosive, thereby serving as a cornerstone investment for those looking for predictable, risk-adjusted growth.
All calculations and valuation estimates are FinancialBeings’ own, based on data sourced from SEC filings (10K and 10Q), use or reproduction before prior approval is prohibited.
Usama Ali
Usama Ali is the founder of Financial Beings and a self-taught investor who blends classic valuation study with insights from psychology. Inspired by works from Benjamin Graham, Aswath Damodaran, Stephen Penman, Daniel Kahneman, and Morgan Housel, he shares independent, data-driven research to help readers connect money, mind, and happiness.
Disclaimer
The content provided herein is for informational purposes only and should not be construed as financial, investment, or other professional advice. It does not constitute a recommendation or an offer to buy or sell any financial instruments. The company accepts no responsibility for any loss or damage incurred as a result of reliance on the information provided. We strongly encourage consulting with a qualified financial advisor before making any investment decisions.