Introduction
An evaluation of financial aspects comparing Exxon Mobil (XOM) with Occidental Petroleum (OXY) will utilize PE ratios, PB values, margins, revenue growth patterns, EBITDA figures, and cash flow data. The analysis of financial figures from Exxon Mobil (XOM) and Occidental Petroleum (OXY) will determine which stock offers the most beneficial investment value.
The evaluation of investments between Exxon Mobil (XOM) and Occidental Petroleum (OXY) depends on investor interest in the energy sector. The better investment return between XOM and OXY becomes significant because both companies operate as leading forces within their respective industries. This blog post evaluates XOM and OXY through metrics including PE ratios together with PB ratios along with margins and revenue growth performance and EBITDA and cash flow indicators.
Financial metrics show that Occidental Petroleum (OXY) displays better financial margins than Exxon Mobil (XOM) together with improved EBITDA statistics and enhanced revenue growth metrics. The operational financial metrics of OXY present robust performance results. XOM presents its stock as a cost-effective choice for investors through valuation metrics that include PE and PB ratios. Exxon Mobil maintains its strategic initiative by initiating team projects with other companies to advance its energy market position.
While OXY delivers higher total value returns the investment consistency alongside major recent accomplishments of XOM should not be ignored. The evaluation of stock valuation metrics helps determine between XOM and OXY which company presents the most promising current investment possibility.
Key Takeaways
1. Even though OXY generates higher profit margins than XOM the actual profitability of the company remains better through its higher revenue.
2. The financial stability of OXY becomes stronger because the company demonstrates superior revenue growth together with stronger EBITDA and free cash flow metrics.
3. XOM offers investors the opportunity to acquire an inexpensive stock through its P/E and P/B ratios thus presenting itself as a desirable value investment for the long term.
4. The valuation metrics employed by OXY including PE along with PE x PB multiple now show performance comparable to XOM’s metrics thus reducing the valuation gap between the two companies.
5. XOM maintains its position as a leading energy company through investments in carbon capture systems as well as LNG operations and new oil reserve acquisitions.
Financial Metrics Comparison for XOM and OXY
Price-to-Earnings (P/E) Ratio for XOM and OXY
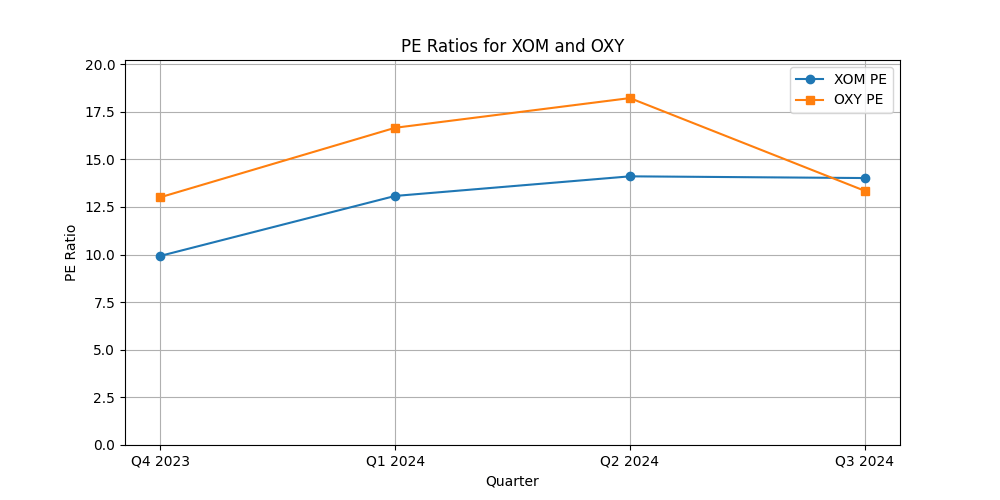
The price-to-earnings (P/E) ratio compares the stock market price with earnings per share (EPS) data to assess the worth of a company. A stock is undervalued in relation to earnings when P/E ratios decline, although investors are willing to pay elevated P/E multiples for anticipated future growth. The P/E ratio of Exxon Mobil for Q3 2024 demonstrates significant rise compared to previous quarters, implying improved earnings potential. The P/E ratio of Occidental Petroleum has attained a value comparable to that of Exxon assuming a competitive enhancement. OXY has attained a valuation parity with Exxon when evaluating their P/E ratios. When considering investments in the energy sector, investors will be drawn to both stocks based on this value criterion. [1]
Price-to-Book (P/B) Ratio for XOM and OXY
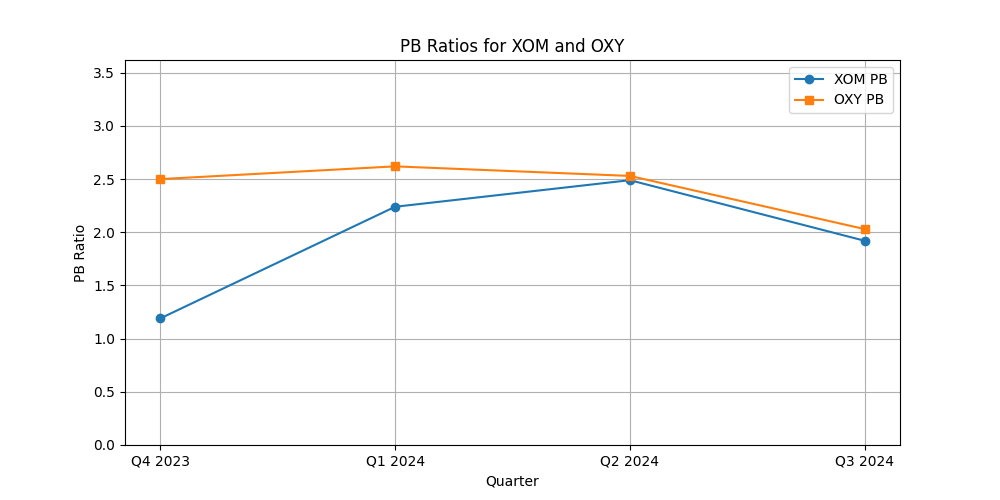
By comparing the stock price to the book value per share, companies can use the price-to-book ratio tool to assess their level of valuation. When the book value of assets is higher than the stock price, investors should view this as a favorable investment opportunity.
According to evaluations of the balance sheets, XOM and OXY have current market P/B ratios that demonstrate that they are below market value. Value investors particularly appreciate the situation since it enables them to purchase stocks at a discount to their true value. Both businesses are in capital-intensive industries, and their book value information allows for a thorough evaluation of their financial stability. Despite not giving enough information about stock value alone, the P/B ratio helps to verify that Exxon and Occidental is accessible at attractive prices. [2]
PE x PB Multiple for XOM and OXY
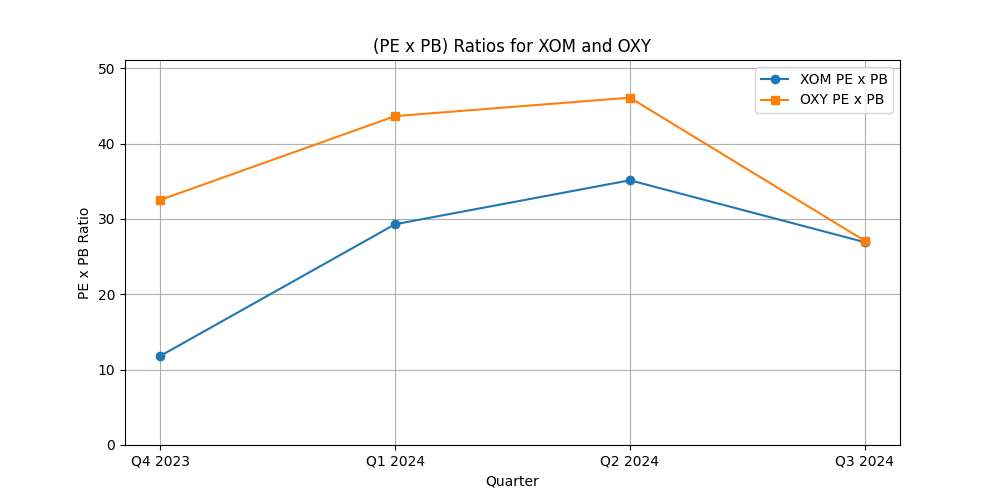
Stock value assessment necessitates the examination of the product of the price-to-earnings (PE) and price-to-book (PB) ratios, which determines overall worth by multiplying the PE ratio by the PB ratio. An investment opportunity is more appealing when the PE * PB multiple exhibits a diminished value. The Q3 2024 PE * PB multiple endorsement for OXY aligns with XOM’s pricing, suggesting that both stocks will yield comparable valuation results from earnings and book value perspectives. XOM formerly exhibited superior combined valuation metrics; however, the markets presently indicate that OXY is equivalent in this respect during Q3 2024. Investors should note this convergence as it indicates OXY is diminishing its valuation difference with XOM. [3]
Gross, Operating and Net Margins for XOM and OXY
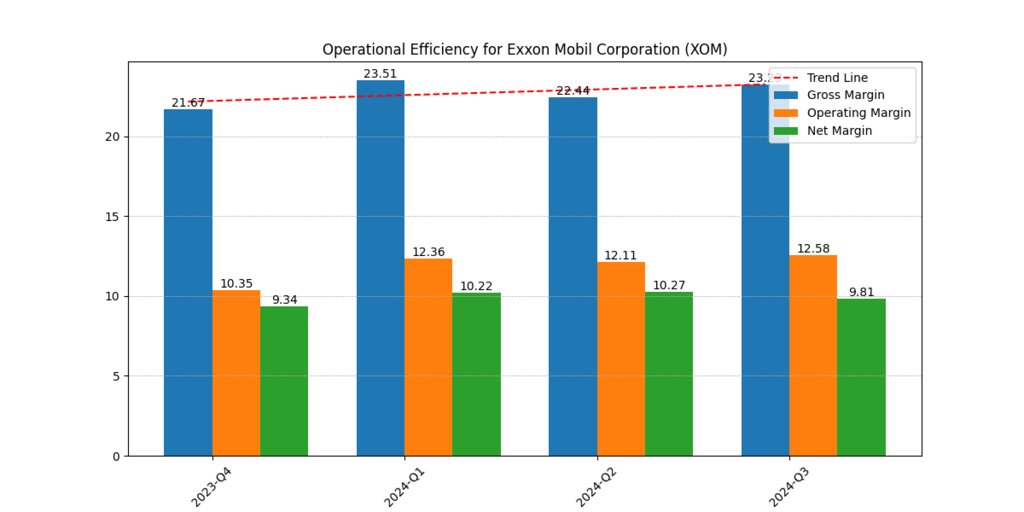
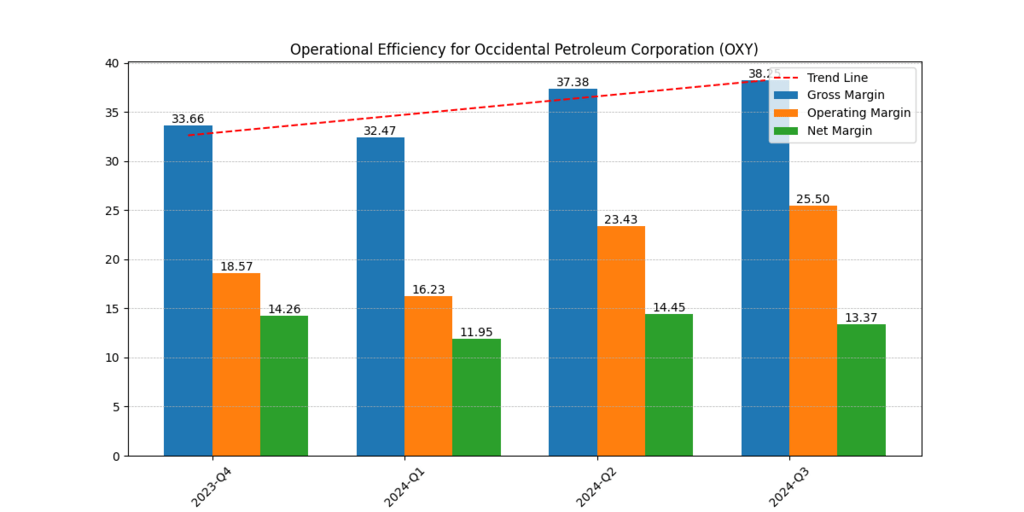
Determining profit margins is crucial to assessing operational effectiveness and profitability. Improved margins let firms generate more profit based on revenue, which increases their financial stability. OXY consistently has higher operating margins and net profits compared to XOM. According to the data, OXY outperforms XOM in terms of revenue stream profitability. The capacity to maintain cost control, along with pricing decisions and operational performance, leads to larger profit margins. Compared to Exxon Mobil, OXY appears more attractive to investors due to its higher profitability measures. [3]
Revenue Growth, EBITDA, and Free Cash Flow (FCF)
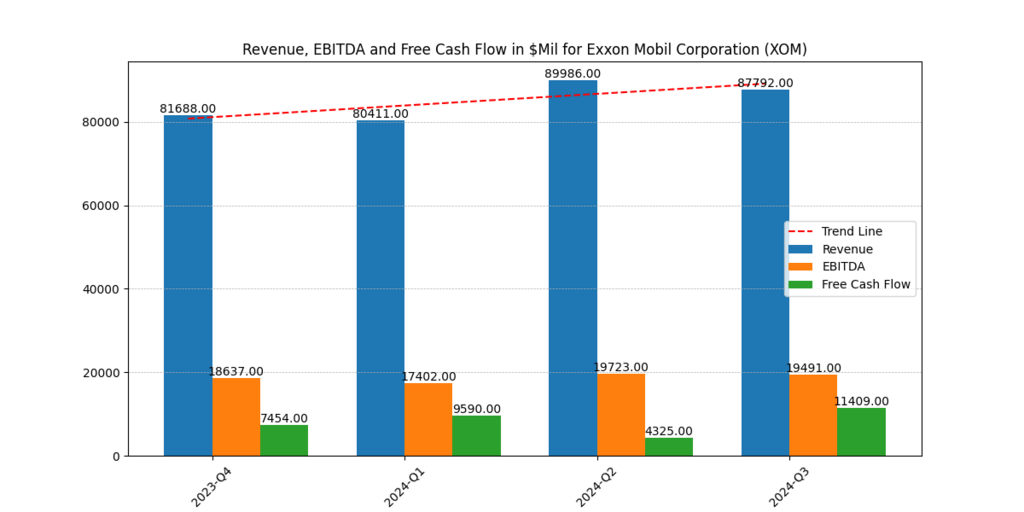
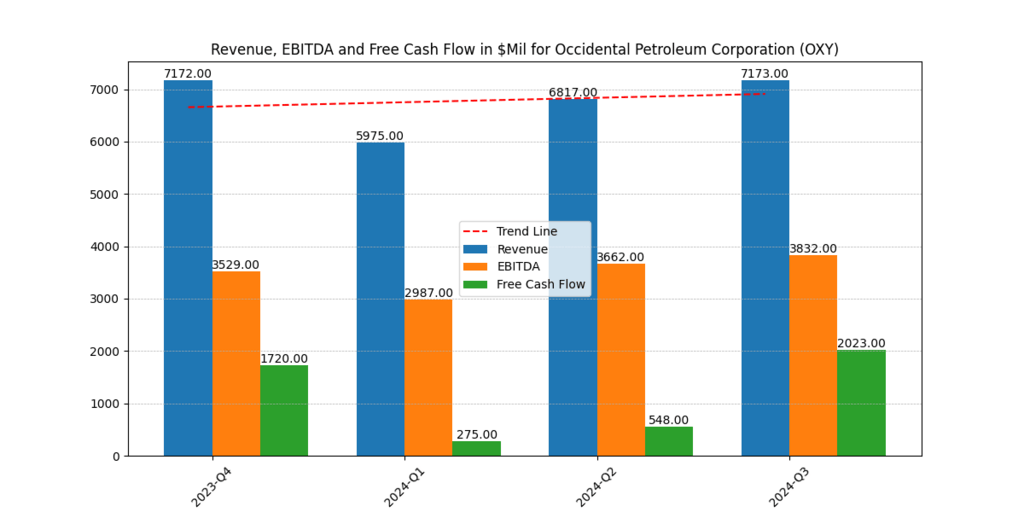
A company’s power to grow both its business operations and market presence appears through revenue growth measurement. OXY demonstrates greater top-line expansion than XOM thus becoming a direct revenue growth competitor to XOM. Successful acquisitions together with strategic pricing methods enable the company to expand through increased production volumes. Businesses can determine their core operational profitability through EBITDA which eliminates costs not linked to their fundamental operations. OXY demonstrates stronger EBITDA growth than XOM which enables it to create substantial operating profitability. OXY exhibits both revenue growth and efficient cost control with its excellent EBITDA numbers. Our detailed analysis and Price Prediction for OXY is in this article Occidental Petroleum (OXY) Stock Analysis and Price Target 2025.
Businesses use free cash flow as an essential financial metric to measure both their ability to give dividend payments and share buybacks and their capability to undertake expansion projects. OXY demonstrates stronger free cash flow generation than XOM which gives it better prospects to conduct company operations together with dividend payments and corporate share repurchases. OXY holds substantial value as a long-term investment due to its generation of considerable operational cash flows.
Revenue growth within a company represents a fundamental sign that directly reflects expanding operations and market penetration. OXY shows significantly faster revenue expansion compared to XOM thus demonstrating major growth in the top line. The growth of OXY primarily arises from expanding output levels alongside improved price outcomes and strategic acquisitions that have proven successful. Businesses can establish their most basic profit levels through EBITDA because the measure removes expenses outside operational parameters.
The operational profits generated by OXY display greater strength than XOM because the company shows better performance in EBITDA growth. The higher EBITDA values indicate OXY brings in growing revenue streams and shows profitability from operating costs. Through its measurement of free cash flow organizations determine their operational status as well as their capacity to expand and enable various shareholder return methods. OXY produces higher levels of free cash flow than XOM thus allowing it to develop its operation by distributing dividends and making shareholder returns and investments. OXY stands apart from different long-term investment possibilities because it provides investors dedicated revenue-generating businesses that produce ample cash flow.
Recent Projects and Collaborations
| Category | Exxon Mobil (XOM) | Occidental Petroleum (OXY) |
| Oil & Gas Exploration | Guyana Oil Discoveries: Ongoing large-scale offshore oil discoveries, boosting long-term reserves and production capabilities. | Permian Basin Expansion: Increased drilling activity and production in one of the most lucrative oil fields in the U.S. |
| Carbon Capture & Sustainability | Carbon Capture Initiatives: Leading CCS projects, investing in carbon capture and storage to reduce emissions and comply with global sustainability goals. | Acquisition of Carbon Engineering: Strengthening position in direct air capture (DAC) technology to advance carbon removal efforts. |
| Natural Gas & LNG | LNG Partnerships: Expanding liquefied natural gas (LNG) projects, securing long-term revenue streams from international markets. | Low-Carbon Hydrogen Projects: Developing hydrogen initiatives as an alternative energy source to align with decarbonization strategies. |
| Technological Innovations | Advanced Refining Technologies: Investing in new refining techniques to improve efficiency and lower costs. | Enhanced Oil Recovery (EOR) Technology: Implementing EOR methods to maximize extraction efficiency from existing oil fields. |
| International Expansion | New Deepwater Investments: Expanding deepwater oil exploration and production, particularly in South America and Africa. | Middle East Partnerships: Strengthening collaborations in the Middle East to develop carbon management and oil extraction projects. |
Conclusion
The energy sector position of Exxon Mobil exists alongside Occidental Petroleum which showcases superior value through different financial ratios. Emphasis on high margin along with growth potential attracts investors to OXY over XOM while investors interested in P/B and P/E ratios prefer XOM for long-term investment purposes. The financial prospects of these stocks suit different investment plans and risk profiles of individual investors.
**Please be informed that the content is informational and by no means serve as a buy or sell signal. The company is not responsible for the loss of capital.
