Introduction
Undervalued Amazon Stock Analysis US – Find out why Amazon might be undervalued in 2025. Examine growth possibilities, price objectives, and value information to uncover market mispricing. One of the most closely watched large-cap technology stocks in the US in 2025 is Amazon.com, Inc. (NASDAQ: AMZN). Analysts contend that the stock’s market price still does not accurately reflect its intrinsic value, despite solid financial fundamentals and growing operational efficiency. Amazon’s valuation has emerged as a crucial case study for undervalued large-cap tech stocks in the US, as investors navigate the post-pandemic economic cycle and the ongoing AI-driven revolution in retail and cloud services (Morningstar, 2024).
With low, medium, and high price projections based on sentiment-adjusted growth expectations and intrinsic value models, this analysis assesses Amazon’s stock valuation forecast for 2025. The psychological factors affecting investor views are further examined, emphasising how market mispricing can endure even when fundamentals improve.
Market Context and Investor Psychology
A phase of cautious optimism has begun for the U.S. equity market, marked by substantial enterprise cloud adoption, resilient consumer spending, and moderate inflation (Bloomberg Intelligence, 2024). Amazon is well-protected against cyclical downturns thanks to its diversification across advertising, AWS, and e-commerce. However, because of recency bias, the propensity to override transient forces like cost-cutting cycles or regulatory scrutiny, market players frequently underestimate the compounding power of Amazon’s high-margin areas.
The inefficiency of valuing is a result of this behavioural miscalculation. Intrinsic valuation techniques indicate that Amazon’s long-term investment potential is still undervalued when compared to its competitors, such as Microsoft and Alphabet, even though investors are still fixated on quarterly income fluctuations.
Comparative Growth Perception
Figure 1 illustrates the contrast between market-implied and intrinsic growth expectations, highlighting a narrow but meaningful discrepancy.
The difference between intrinsic and market-implied growth forecasts is depicted in Figure 1, showing a small but significant difference.
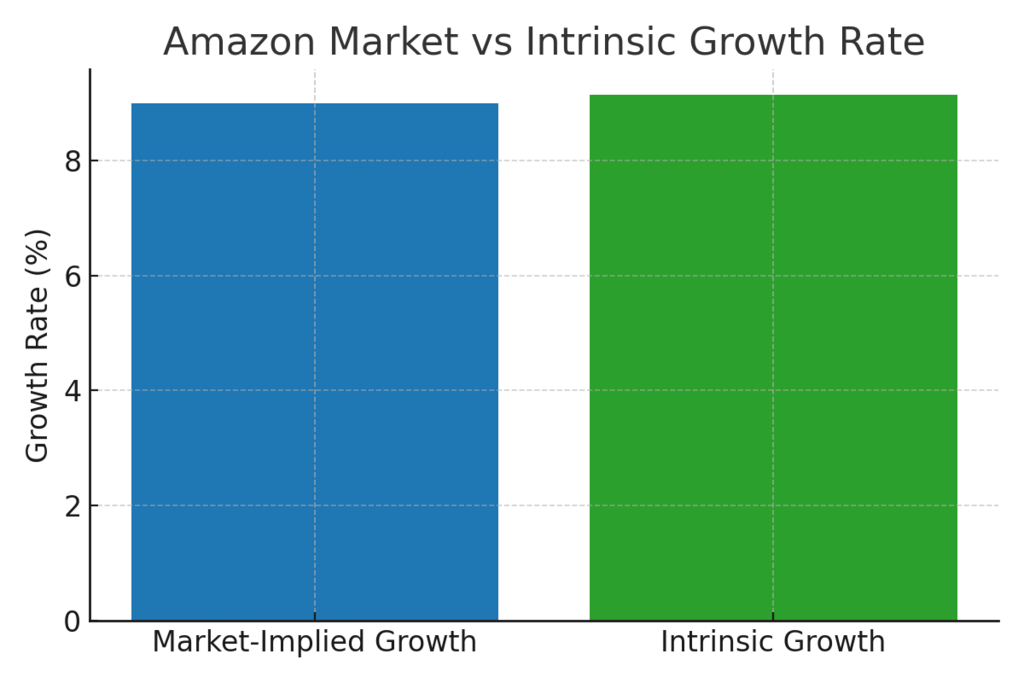
Figure 1: Amazon Market vs. Intrinsic Growth Rate
The graph shows that although the market places a conservative price on Amazon’s growth, intrinsic models predict somewhat higher sustainable growth, indicating a moderate undervaluation. According to value psychology, this disparity is an example of asymmetric optimism, which occurs when logical investors undervalue their potential for future reinvestment, resulting in suppressed price multiples.
Valuation Framework and Scenarios
A discounted cash flow (DCF) model was used to evaluate Amazon’s intrinsic value computation. It used conservative long-term cash flow predictions and a cost of equity that reflected both U.S. Treasury yields (as of Q2 2025) and Amazon’s beta.
Three valuation scenarios are summarised below:
| Scenario | Assumption Outlook | Valuation ($/Share) |
| Low Case | Weaker AWS expansion, macro slowdown | 168 |
| Medium Case | Steady revenue growth, margin stabilisation | 191 |
| High Case | Accelerated AI adoption, advertising surge | 250 |
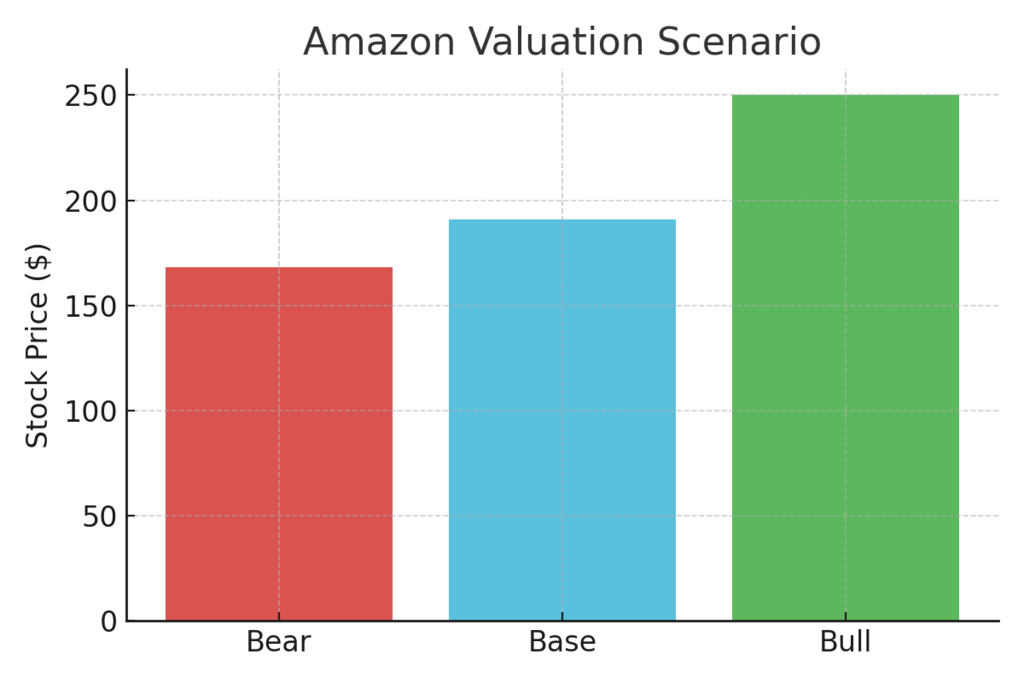
Figure 2: Amazon Valuation Scenarios
The idea that Amazon stock is undervalued is supported by the bull case valuation of $250, which indicates a fair intrinsic price that is somewhat higher than the current market level. While the bear case at $168 takes into account cost inflation and global consumer weakening, the base case at $191 is consistent with consistent estimates of consumer spending and stable margins.
These prices demonstrate the reasonable range in which portfolio positioning can be guided by Amazon price target analysis. When it comes to long-term asset allocation, investors who use probabilistic valuation ranges tend to fare better than those who rely solely on consensus predictions (Financial Times, 2025b).
Analyst Consensus Price Targets for Amazon.com, Inc. (2025)
| Estimate Type | Price Target (USD) | Interpretation |
| High Estimate | $306 | Optimistic view reflects accelerated AWS and AI-driven growth. |
| Median Estimate | $265 | Market consensus fair value for the next 12 months. |
| Low Estimate | $206 | Conservative scenario factoring macro and regulatory risks. |
Financial Strength and Leverage Analysis
The stability of Amazon’s balance sheet continues to be a key factor in bolstering its intrinsic value. The trend of the assets-to-liabilities ratio during the last few quarters is shown in Figure 3.
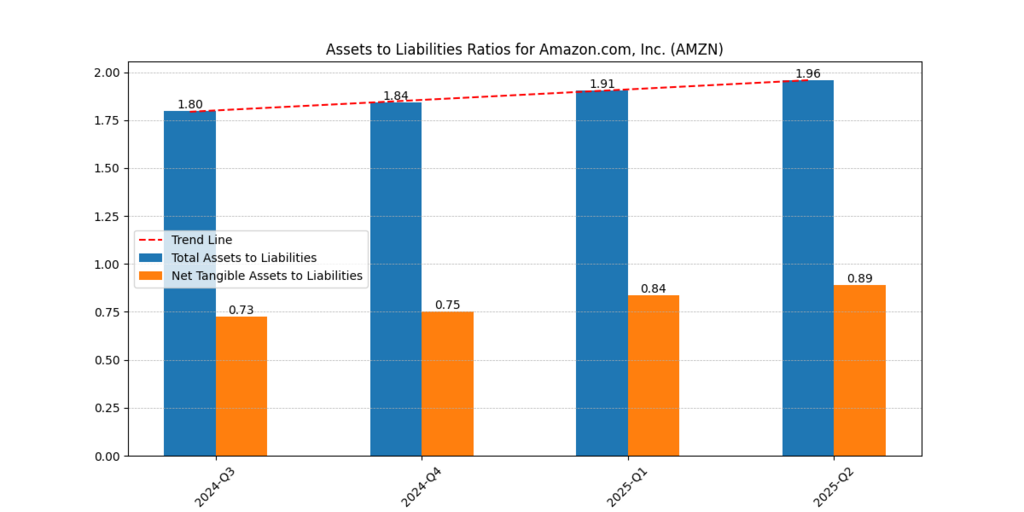
Figure 3: Assets to Liabilities Ratios for Amazon.com, Inc.
As can be observed, tangible assets to liabilities increased from 0.73 to 0.89, while total assets to liabilities improved from 1.80 in Q3 2024 to 1.96 in Q2 2025. Stronger liquidity positioning and lower leverage risk are implied by this increasing trajectory.
Such steady deleveraging indicates operational discipline to investors evaluating undervalued large-cap tech stocks US. Additionally, the trend line’s higher slope indicates a move toward a more conservative capital structure, which is advantageous for long-term investments in Amazon stock.
Operational Efficiency Metrics
Another important metric in the Amazon stock valuation forecast 2025 is operational efficiency. Amazon’s net, operating, and gross margins for four consecutive quarters are shown in Figure 4 below.
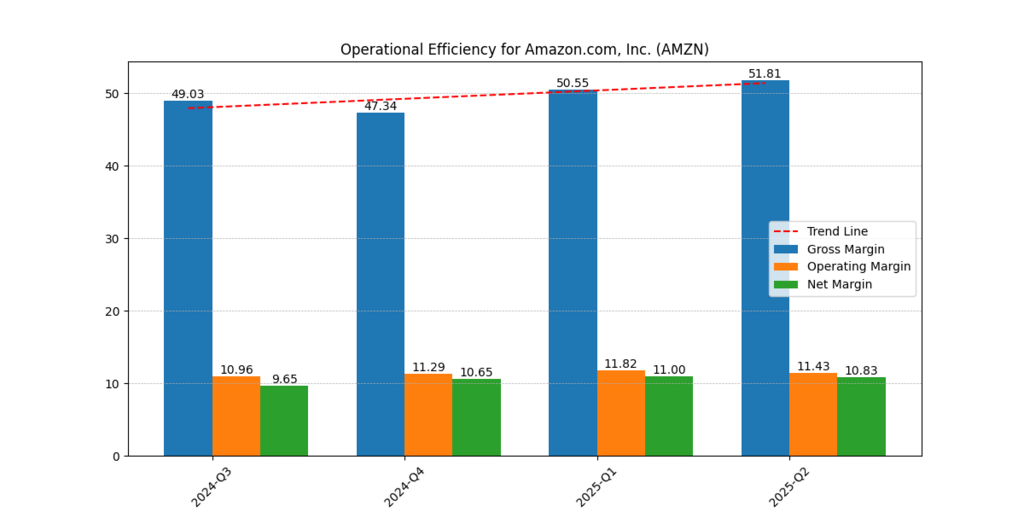
Figure 4: Operational Efficiency for Amazon.com, Inc.
From 47.34% in Q4 2024 to 51.81% in Q2 2025, the gross margin increased, indicating strong cost control and increased AWS profitability. While the net margin remained steady at 10.8%, the operating margin rose from 9.65% to 11.43%.
Revenue and Cash Flow Dynamics
A key component of Amazon’s stock growth scenarios lies in its capacity to produce steady free cash flow (FCF). The revenue, FCF, and EBITDA for the last four quarters are summarised in Figure 5.
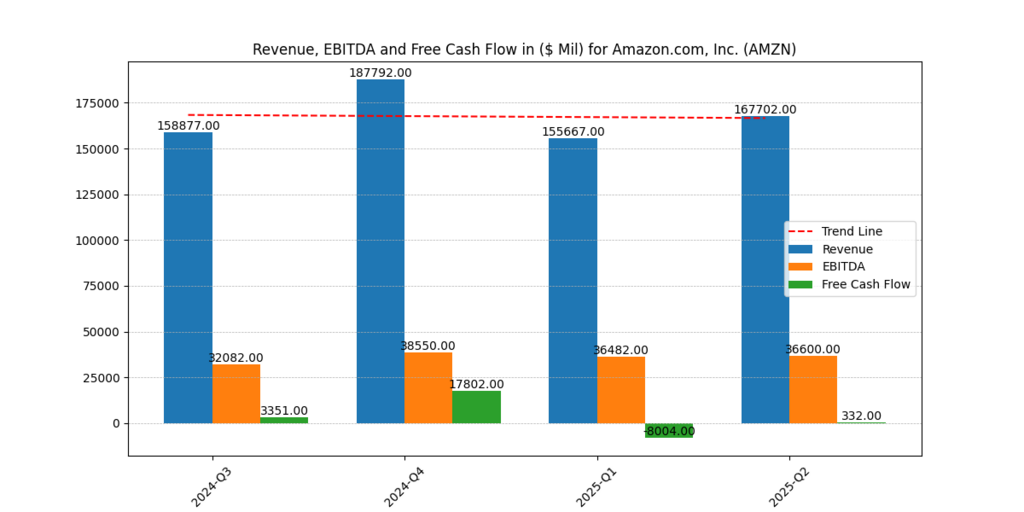
Insert Figure 5: Revenue, EBITDA, and Free Cash Flow for Amazon.com, Inc.
In Q2 2025, revenue increased from $158.8 billion in Q3 2024 to $167.7 billion, while EBITDA stayed robust at about $36.6 billion. Interestingly, FCF, despite its volatility, shows Amazon’s strong cycle of reinvestment, rising from $3.3B to $0.33B as capital expenditures to support AI infrastructure climbed.
Interpreting Market Mispricing
When sentiment deviates from the fundamentals, market mispricing frequently happens. This disparity in Amazon’s situation results from three interconnected psychological biases:
- Anchoring Effect: Despite structural profitability gains since then, investors contrast Amazon’s current valuation multiples with historical peaks during the 2021–2022 e-commerce boom.
- Overreaction Bias: In contrast to long-term earnings growth from AWS and digital advertising, short-term unfavourable news (such as macro uncertainty) is frequently overestimated.
- Confirmation Bias: Even when the fundamentals support accumulation, many institutional investors prefer diversification away from mega-caps, which results in systematic underweighting.
Contrarian investors who concentrate on Amazon price target analysis based on fundamentals rather than market sentiment can benefit from such biases.
Further Reading : Top 5 AI Stocks to Buy Now: The AI Giants!
Strategic Outlook and Competitive Position
Amazon’s ecosystem synergy, which includes AI services, shipping, and retail, keeps growing. Revenue durability is improved by AWS’s growth into corporate software and integration with generative AI tools. Furthermore, the company’s advertising division is expanding more quickly than e-commerce revenues, suggesting room for profit growth.
Amazon’s value multiples continue to fall below its intrinsic range when compared to its peers, indicating relative undervaluation. This supports the idea that Amazon is an undervalued large-cap tech stock in the US that will rise again once sentiment levels off and capital expenditure yields start to convert into free cash flow (Goldman Sachs, 2025).
Long-Term Investment Implications
The strongest case for long-term investment in Amazon stock is found in the combination of earnings momentum, balance sheet strength, and operational efficiency. Over the next ten years, the company’s innovation-driven strategy guarantees steady cash generation.
As the difference between Amazon’s intrinsic value calculation closes, investors who spot market underreaction to these adjustments can attain alpha. Therefore, the mid-term price target of $191 is a milestone toward equilibrium revaluation rather than a cap.
Conclusion
Amazon’s intrinsic valuation shows that the company still has solid fundamentals supporting future development, even in the face of short-term mood swings. The stock’s undervaluation results from enduring cognitive biases in market perception rather than poor performance.
With a low estimate of $191 and DCF-derived valuations ranging from $168 (medium) to $250 (high), Amazon is a logical long-term prospect among inexpensive tech titans. A buy-and-hold strategy based on psychological market inefficiencies, reinvestment ability, and financial discipline is supported by the data.
Amazon stock valuation forecast 2025 highlighting price targets for bear, base, and bull scenarios, with all calculations independently conducted by the author using verified data from Amazon’s 10-K and 10-Q filings submitted to the U.S. SEC
Frequently Asked Questions (FAQ)
Is Amazon stock undervalued right now?
Several models and analysts contend that AMZN trades below its true value, pointing to rising margins and long-term cash flow possibilities. Double-digit undervaluation is estimated in recent DCF write-ups, though views differ depending on assumptions and segment outlooks.
What do scenario analyses typically show for AMZN?
Wide fair-value ranges show vulnerability to WACC, terminal growth, and segment margins; bear/base/bull frameworks frequently centre on slower retail vs. better AWS/ads trajectories.
What are the current consensus price targets for Amazon?
With lows around ~$195–$230 and highs around ~$305, consensus snapshots tend to cluster around the mid-260s, suggesting a mid-teens to ~20% upside from recent pricing.
What catalysts could close the “undervaluation” gap?
Estimates and valuation multiples may rise in response to sustained AWS growth from gen-AI workloads, ongoing increases in ad share, and proof of logistics monetization outside of first-party retail.
What are Amazon’s key growth engines for 2025–2030?
Over the next three to five years, it is expected that AWS (AI-driven cloud workloads), advertising (high-margin, rapidly expanding), and logistics/supply-chain services would drive revenue and operating leverage.
Usama Ali
Usama Ali is the founder of Financial Beings and a self-taught investor who blends classic valuation study with insights from psychology. Inspired by works from Benjamin Graham, Aswath Damodaran, Stephen Penman, Daniel Kahneman, and Morgan Housel, he shares independent, data-driven research to help readers connect money, mind, and happiness.
Disclaimer
The content provided herein is for informational purposes only and should not be construed as financial, investment, or other professional advice. It does not constitute a recommendation or an offer to buy or sell any financial instruments. The company accepts no responsibility for any loss or damage incurred as a result of reliance on the information provided. We strongly encourage consulting with a qualified financial advisor before making any investment decisions.