Apple Inc. (AAPL) and Meta Platforms Inc. (META) are two of the best stocks to buy in 2025, as the financial world remains volatile yet holds considerable promise for technology companies. Such companies have maintained healthy financial foundations, strong operating performance, and robust shareholder returns, as reflected in the charts and financial ratios from the previous year. The combination of critical financial ratios, margins, return indicators, and valuation multiples provides an overview of the company’s economic standing and prospects for potential investors.
Capital Structure & Asset Utilisation
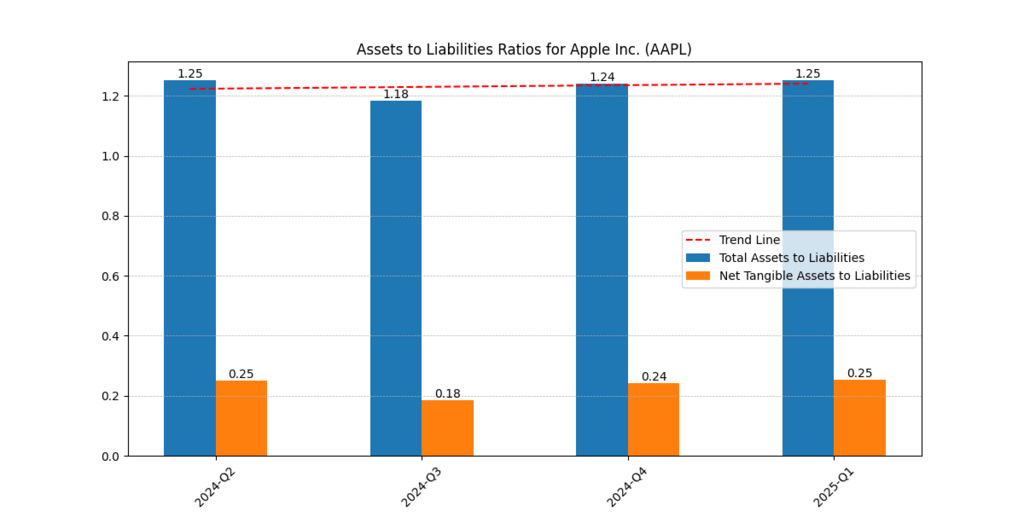
At Apple, the capital structure is stable and conservative. It had a total assets-to-liabilities ratio which has been trading between 1.18 and 1.25 during the past four quarters (2024-Q2 to 2025-Q1). This is an indicator of moderated leverage usage. Meta, in contrast, has significantly higher ratios, notably ranging between 2.79 and 3.13, indicating that the company is utilising a greater equity cushion and relatively little debt.
Additionally, Meta’s Equity Ratio is 78.89%, while Apple’s is 40.49%, indicating a more conservative leverage position for Meta. Meta is appealing to risk-averse portfolios as investors prefer companies with robust asset coverage in uncertain situations.
Operational Efficiency and Profit Margins
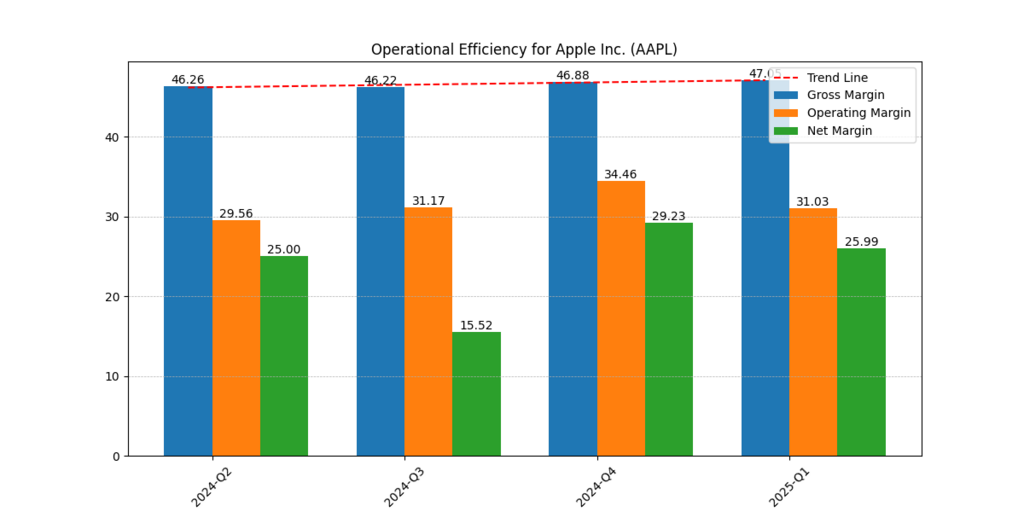
In an interval of operating performance, Meta outperforms Apple significantly. Meta’s gross margins have remained above 81% in the previous four quarters, while Apple’s have been around 46%. Meta has an average net margin of 39.11 per cent, compared to 24.30 per cent in Apple, meaning that Meta generates more value from each dollar of sales than Apple. Our Deep Dive Aarticle on Nvidia and AMD here.
The difference between Apple and Meta is further highlighted by the fact that the former has a higher Return on Sales compared to the latter, at 39.11% versus 24.30%. Big margins give Meta a bigger margin to eat macroeconomic shocks, which makes it a good bet in a list of the best stocks to buy in 2025.
Return on Capital & Equity Efficiency
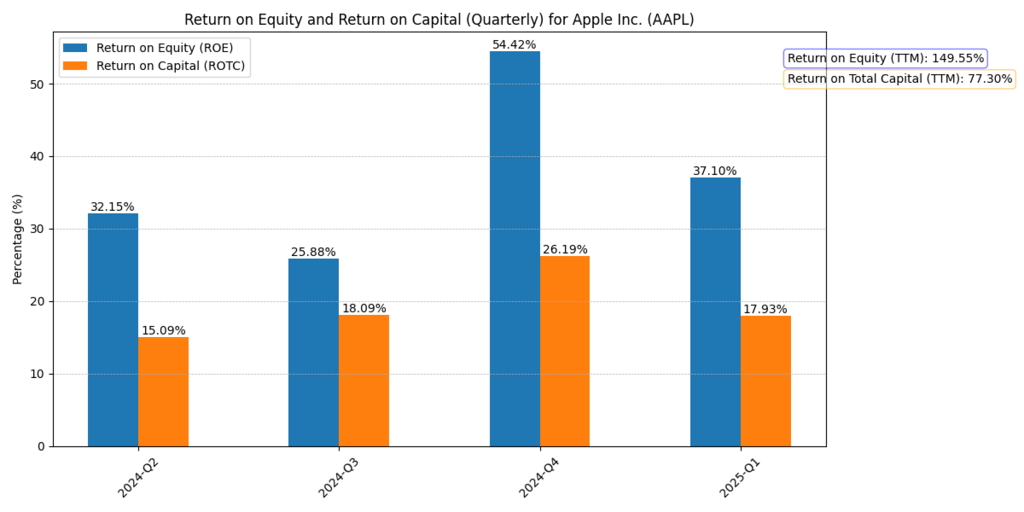
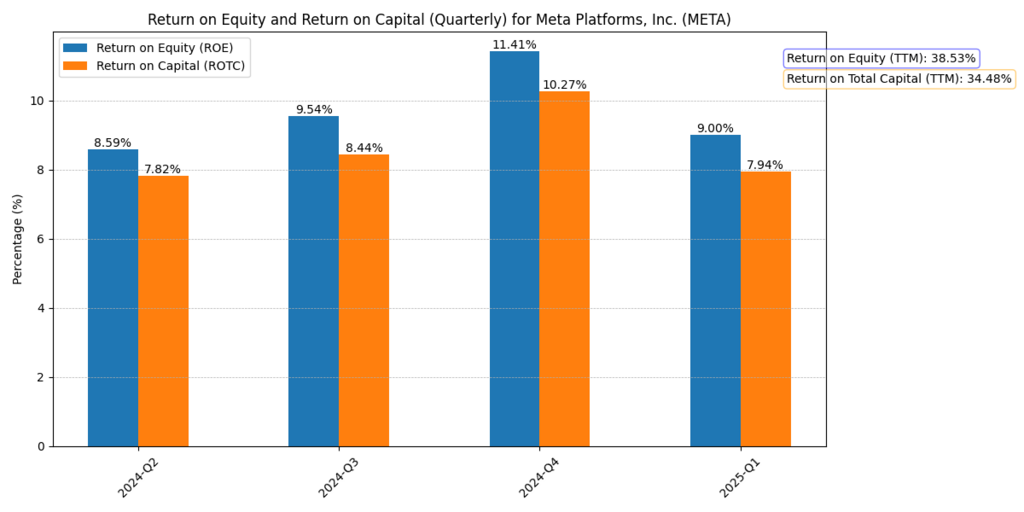
Apple has a high capital efficiency. The Return on Equity (ROE) has reached the peak of 54.42 at the end of Q4 2024, and the 149.55% trailing-twelve-month (TTM) ROE is attributed to the high financial leverage (4.96x) of the company. In contrast, Meta has relatively less leverage and a slower capital utilisation rate, with its TTM ROE at only 38.53%.
When referring to Return on Total Capital (ROTC), Apple once again outpaces Meta, with a return of 77.2% compared to 32.27%. Better utilisation of the invested capital. This fact means that Meta is more preferable to conservative investors, but Apple is more capital-efficient and has a higher prospective return, which is appealing to growth-oriented investors.
Revenue, EBITDA, and Cash Flow Performance
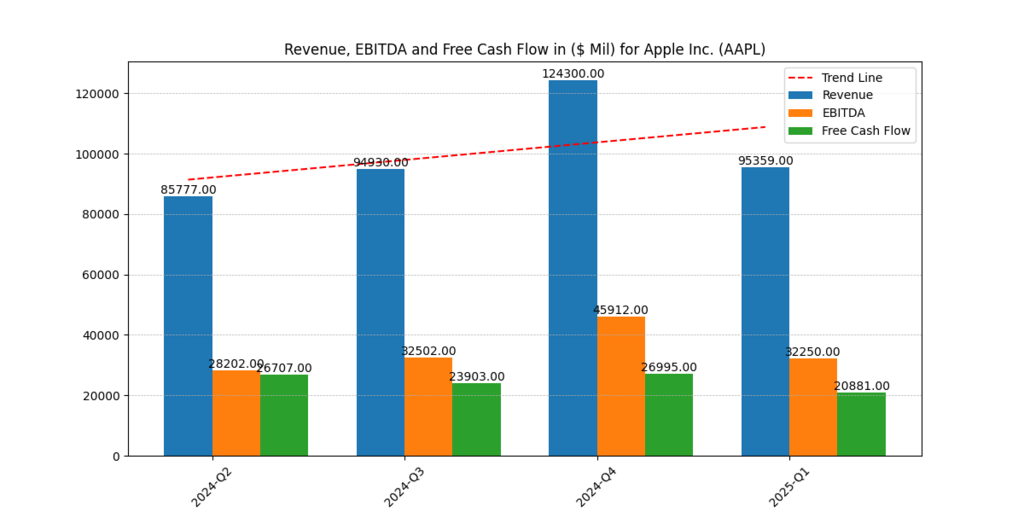
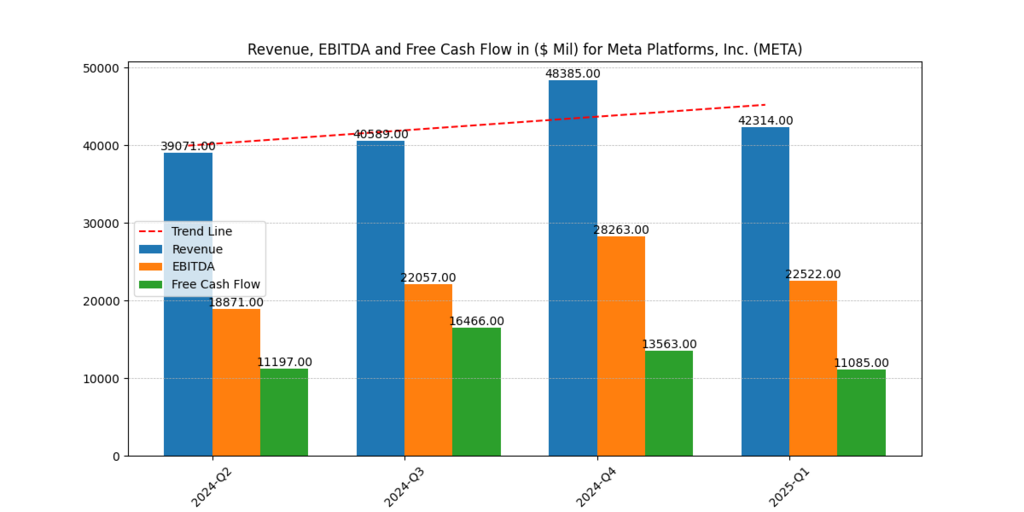
Both companies demonstrated variable yet substantial revenues and profits. In Q4 2024, Apple reported a peak revenue of $124.3, EBITDA of $45.9, and Free Cash Flow (FCF) of $26.99B Compared to Meta, the company generated a maximum revenue of $ 48.4B in the corresponding quarter, with EBITDA at $ 28.2B and FCF at $ 13.56B.
Although on a smaller scale, Meta has a lower EV/EBITDA ratio (20.26x) than Apple (23.06x), indicating that Meta may be undervalued in terms of earnings. Additionally, the FCFE of Meta is higher compared to that of Apple, indicating a greater prospect of shareholder payments of $147.9 billion versus $ 109.8 billion.
Core Financial Metrics Comparison
| Metric | AAPL | META | Industry Avg. | Better Performer | Comment |
| ROE (%) | 145.66 | 36.01 | 90.83 | AAPL | AAPL shows an exceptional return to equity holders |
| ROTC (%) | 77.2 | 32.27 | 54.74 | AAPL | Stronger capital efficiency by Apple |
| Gross Margin (%) | 46.63 | 81.75 | 64.19 | META | META has higher product profitability |
| Net Margin (%) | 24.3 | 39.11 | 31.71 | META | META retains more profit per revenue |
| EV/EBITDA | 23.06 | 20.26 | 21.66 | META | Lower multiple makes META slightly more attractive. |
| Equity Ratio (%) | 40.49 | 78.89 | 59.69 | META | META is less leveraged than AAPL |
Conclusion
This analysis shows that Apple and Meta are uniquely positioned to perform better in 2025-though, though on different strengths. Apple Inc. remains capital-efficient and a leader in generating shareholder value, with one of the highest industry ROEs at 145.66% and an EBITDA of more than $138 billion. This renders Apple especially appealing to shareholders who seek robust income and prudent capital deployment strategies.
Meta Platforms Inc. stands out well due to its high operating efficiency, with gross margins exceeding 80%, a net margin of over 39%, and an equity ratio of 78.89%, reflecting a highly conservative balance sheet. (Morningstar, 2024; Meta Platforms, 2024). META presents an interesting proposition to investors concerned with financial soundness, dependability of cash flow, and scalability.
Apple has been able to improve its leveraged returns, driving its performance, whereas Meta has implemented a sustainable and cash-abundant operating strategy. To conclude, both organisations demonstrate features of the best stocks to buy in 2025 not only because of their past performance but also due to their auspicious market positions, innovation potential, and financial discipline (Damodaran, A. 2024).
Disclaimer
The content provided herein is for informational purposes only and should not be construed as financial, investment, or other professional advice. It does not constitute a recommendation or an offer to buy or sell any financial instruments. The company accepts no responsibility for any loss or damage incurred as a result of reliance on the information provided. We strongly encourage consulting with a qualified financial advisor before making any investment decisions.