NVIDIA and AMD are two names that crop up most often when people talk of the best AI stocks to buy. Both companies play a crucial role in defining the future of artificial intelligence due to their powerful GPU platforms and broad ecosystems. Nevertheless, although AMD has taken admirable steps in the CPU and data center markets, NVIDIA outweighs the AI chip market by far, in part due to the CUDA ecosystem, as well as a focus on AI-first earlier in 2025 (NVIDIA, 2025).
The AI market is supposed to be much more significant in the next few years, and investors are eager to know who performs best. Therefore, it is crucial to examine these tech giants to find the best AI stocks to buy in 2025.
In this article, focus is on in-depth Alpha score comparison of NVIDIA Corporation (NVDA) versus Advanced Micro Devices, Inc. (AMD), with emphasis on the following factors; important financial ratios, such as margins, return on capital (ROTC), return on equity (ROE), free cash flow (FCF), and valuation ratios. Its purpose is to give investors a data-driven roadmap on how to make informed decisions when picking the stocks.
Furthermore, through strategic alliances and increased R&D investments, both companies are hoping to get a bigger entry into the market share of AI semiconductors. This competitiveness makes the AI investment environment plentiful, and creating an adequate financial analysis before determining the best AI stocks to buy is significant.
Margin Analysis: Profitability Powerhouse
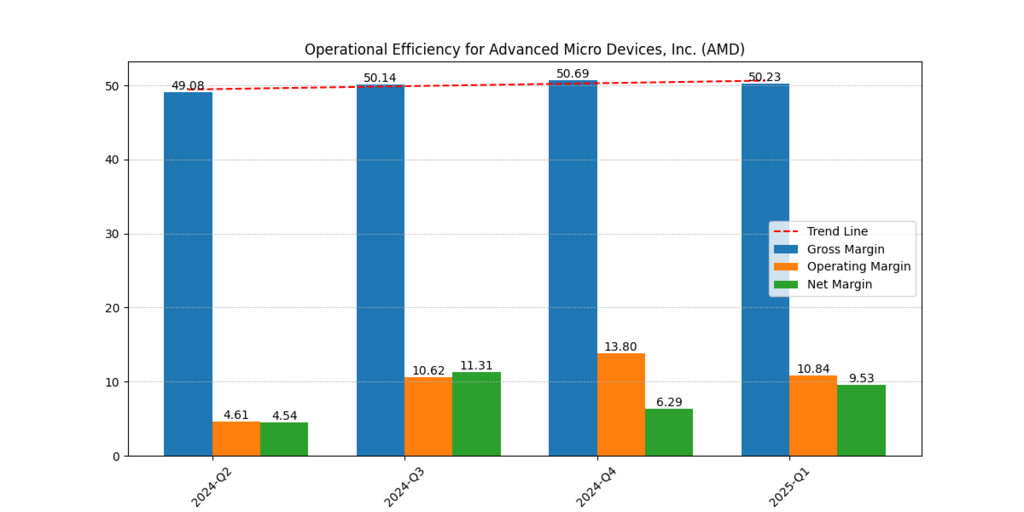
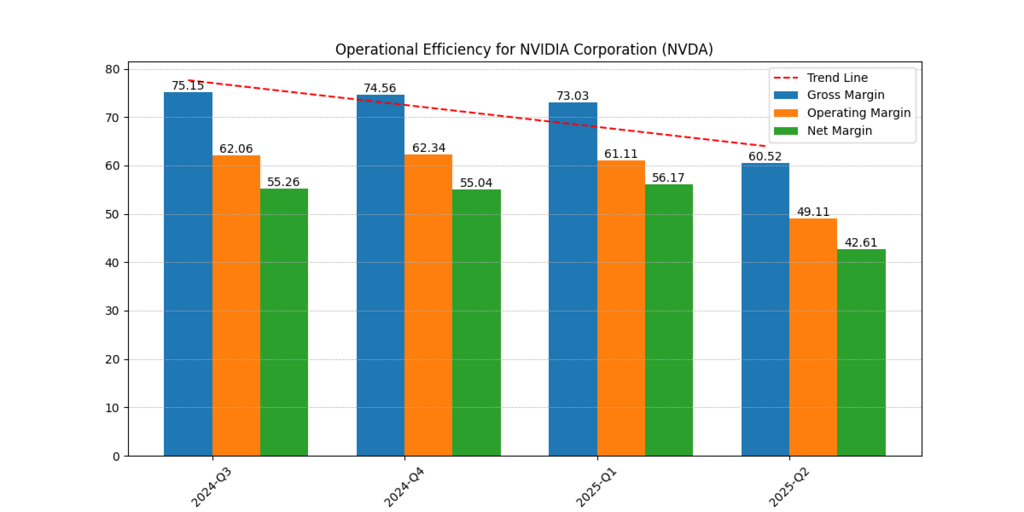
Profitability of AI chipmakers lies in margins. NVIDIA dominates in this segment by massive margins on AI and data center products with high value.
It also has a strong strategic pricing power and product portfolios which provide it with high gross and operating margins.
By comparison, AMD has thinner margins, operating on a price competitive basis both in consumer and enterprise markets and would be more susceptible to variance in costs and market fluctuations.
Quarterly Margin Comparison
| Company | Gross Margin (%) | Operating Margin (%) | Net Margin (%) |
| AMD | 50.09 | 10.29 | 8.03 |
| NVIDIA | 70.11 | 58.03 | 51.69 |
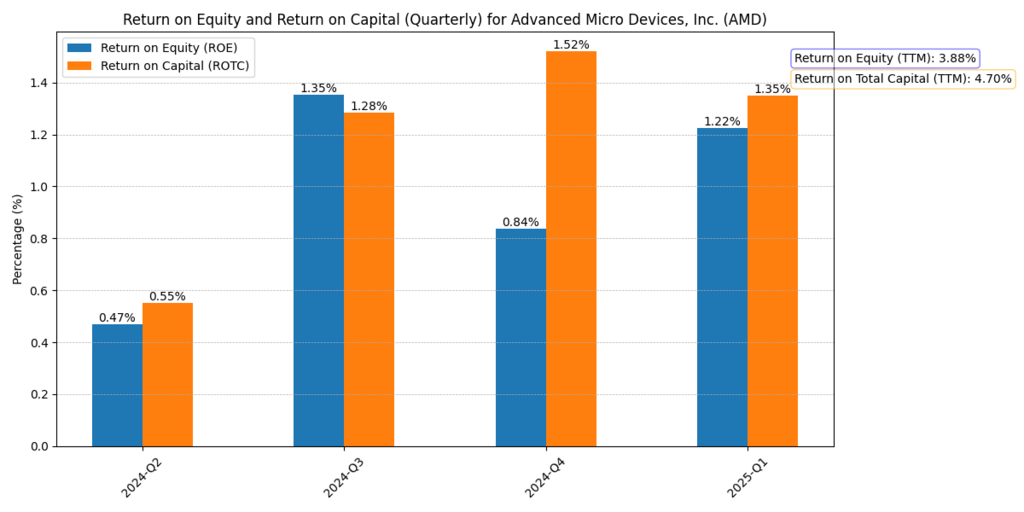
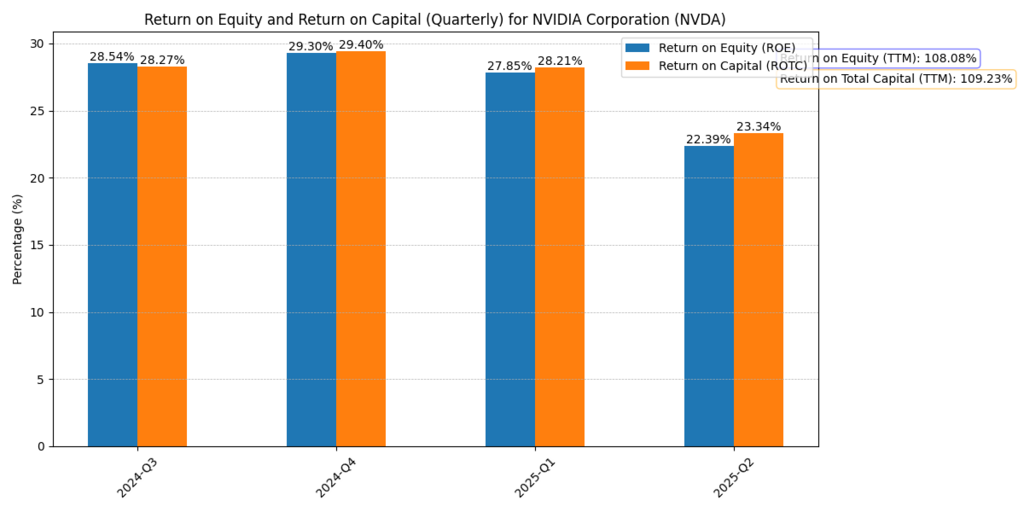
Return on Equity & Capital: Measuring Efficiency
The basic ratios to comprehend how effectively a business transforms shareholders and overall invested capital into profit are Return on Equity (ROE) and Return on Total Capital (ROTC).
NVIDIA has an exponentially better capital efficiency by leveraging more than 90 times of equity, whereas AMD can barely crack 5 percent.
Such an outstanding distinction indicates the effectiveness of NVIDIA to extract considerable profits out of each dollar invested, which is supported by high demand and well-structured control of operations.
Quarterly Return Comparison
| Metric | AMD (%) | NVIDIA (%) |
| Return on Equity | 3.85 | 91.57 |
| Return on Total Capital | 4.53 | 94.45 |
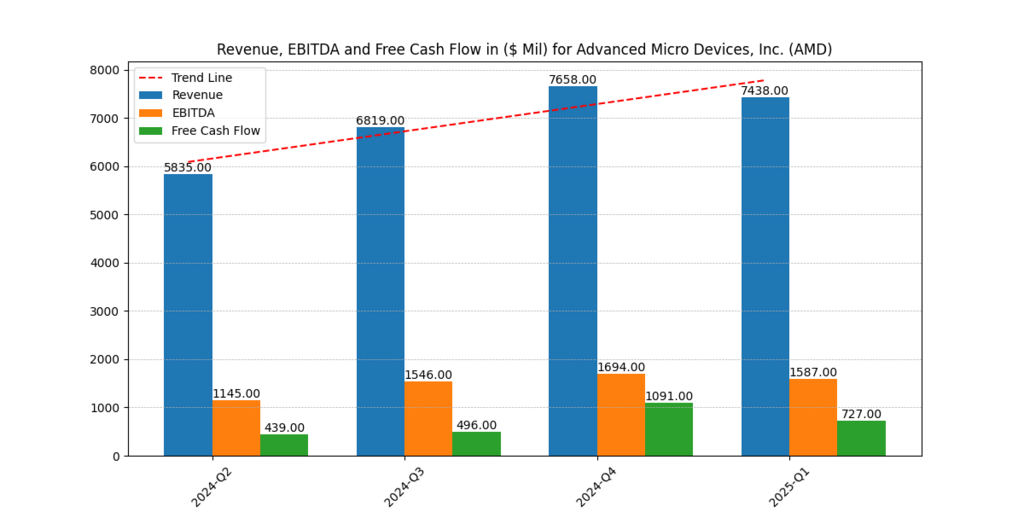
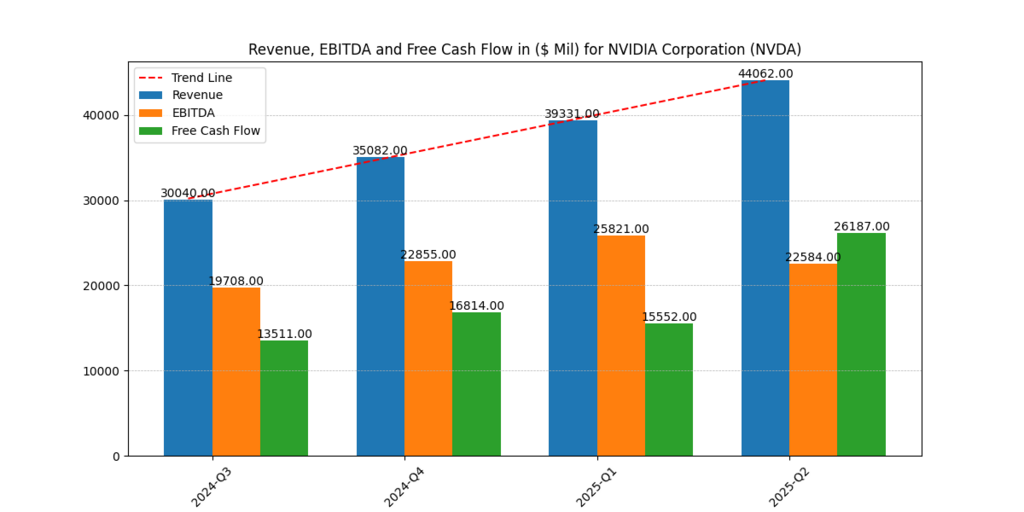
Free Cash Flow (FCF): Liquidity and Scalability
The free cash flow (FCF) is an important indicator of the available money a company may reinvest or pay dividends to shareholders.
This shows that the free cash flow of NVIDIA is over 10 times greater than AMD, which highlights its superior financial flexibility.
This helps NVIDIA to finance proactive innovation, strategic acquisitions, and drive shareholder value. AMD is a profitable Company, but the FCF available to it is limited and should be used wisely to continue with the growth and development of its products.
Free Cash Flow Comparison (Millions $)
| Metric | AMD | NVIDIA |
| FCFE | 4,909 | 80,252 |
| FCFF | 3,500 | 65,450 |
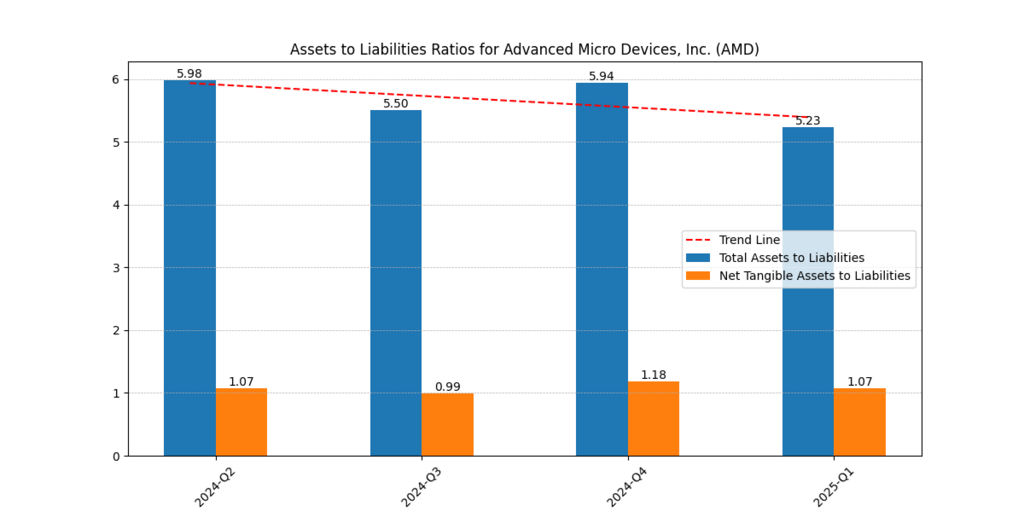
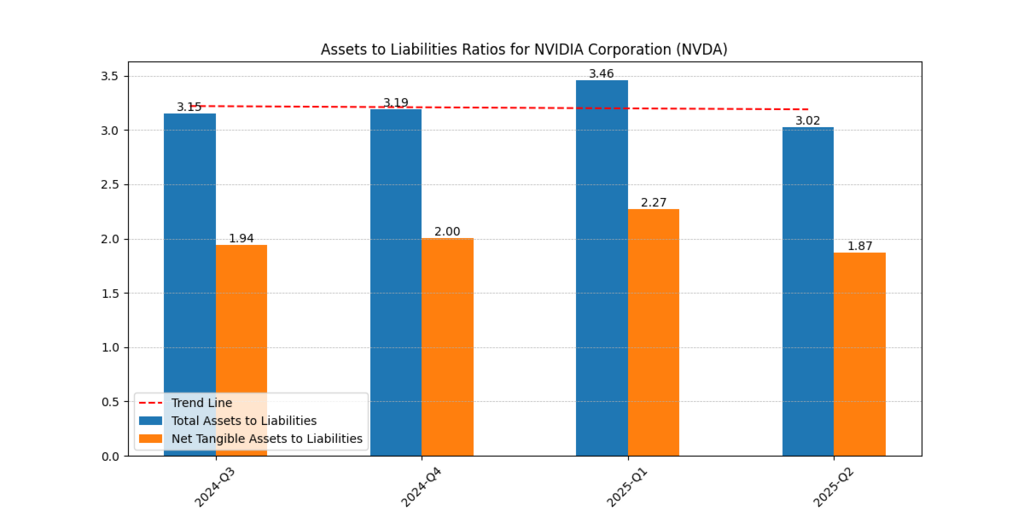
Leverage & Assets: Capital Structure
A healthier balance sheet makes it easier to survive in the event of a downturn and also allows expansion.
AMD has an enhanced ratio of assets to liabilities, which shows a less risky financial structure and capital base as well.
However, moderate leverage sported by NVIDIA is analytically employed to compound returns, and therefore, it can grow faster and assiduously deal with investors with the consistency of its performance.
| Quarter | AMD Total A/L | NVDA Total A/L |
| Latest | 5.23 | 3.02 |
Valuation Metrics: Is Growth Priced In?
Valuation is used to guide the view that the stock price is overvalued or represents the growth potential of the stock. NVIDIA is both cheaper on a PE and yet has far superior earnings and ability to raise cash flow. This indicates a valuation overstretch on the side of AMD concerning fundamental values.
| Metric | AMD | NVIDIA | Winner |
| Net Margin (%) | 8.03 | 51.69 | NVIDIA |
| ROE (%) | 3.85 | 91.57 | NVIDIA |
| FCFE ($M) | 4,909 | 80,252 | NVIDIA |
| Gross Margin (%) | 50.09 | 70.11 | NVIDIA |
| PE Ratio | 93.61 | 46.25 | NVIDIA |
Conclusion: Which Stock Is among the Best AI Stocks to Buy?
According to the thorough financial analysis, NVIDIA wins in almost all of the important metrics:
- It has much better margins with strong gross, operating, and net profitability.
- ROE and ROTC reflect their capital efficiency as those companies deliver very large returns to their shareholders (Yahoo Finance, 2025).
- Its free cash flow and cash generating capabilities are much faster than AMD, with the potential to reinvest more and reward shareholders more.
- In valuation, NVIDIA is selling with a more realistic PE ratio based on its earnings and cash.
So, it is safe to say that when analyzing the best AI stocks to buy in 2025, NVIDIA must be close to the top of any realistic long-term technology investment portfolio. The company occupies a unique niche in being both at the forefront of AI studies and cutting-edge GPU development as well as actively deploying AI in the enterprise, which makes it the leader in its sphere (Macrotrends, 2025).
Disclaimer
The content provided herein is for informational purposes only and should not be construed as financial, investment, or other professional advice. It does not constitute a recommendation or an offer to buy or sell any financial instruments. The company accepts no responsibility for any loss or damage incurred as a result of reliance on the information provided. We strongly encourage consulting with a qualified financial advisor before making any investment decisions.