Introduction
Conduct a study on Nvidia Valuation and Implied Growth rate to establish whether the premium of NVDA in 2025 is valid. Analyze AI-based growth of revenues, pattern of profits, value signals, etc, and identify to what level the development has already been enshrined in Nvidia shares.
The discussion of the investors, Nvidia Corporation (NASDAQ: NVDA) is considered the most powerful semiconductor and AI computing company in the world in 2025. Its valuation, which has not deteriorated much from historic highs, suggests investors believe the company can remain the leader in generative AI and accelerated computing over the next decade. The question, however, is also of great importance: Is Nvidia’s price in the market today driven by sustainable fundamentals, or by investor sentiment and optimism?
What is the Nvidia Valuation and Implied Growth Rate? This understanding helps investors distinguish between reasonable optimism and overextension. Over a three-year period, the company has increased revenue by over 4 times due to soaring demand for data-center GPUs, AI systems, and autonomous systems. Nevertheless, as the AI semiconductor market outlook 2025 from an early hyper-growth phase to stabilization, investors will need to evaluate Nvidia’s ability to sustain high valuation multiples based on its profits, cash flows, and residual earnings.
The article analyses the financial trends, leverage position, and the NVDA stock price vs intrinsic value of Nvidia’s company using residual income and a valuation model based on returns. It also incorporates findings from behavioral finance, which show that human psychology, particularly biases such as overconfidence and representativeness, tends to inflate price-to-growth expectations. It is supposed to answer not only the question of Nvidia’s value as of now but also how much of the company’s success lies ahead of the price (Damodaran, 2024).
Financial Trajectory
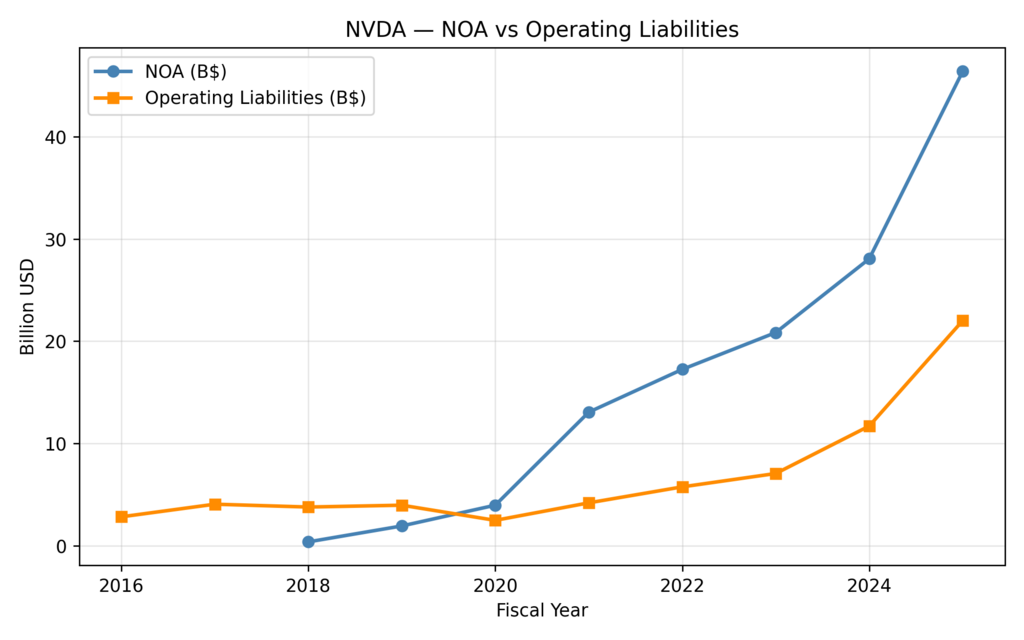
Figure 1: Net Operating Assets of Nvidia (NOA) against Operating Liabilities (2016-2025). The constantly growing gap indicates a more rapid investment in AI infrastructure and data-centre capacity than in liabilities, suggesting better capital efficiency.
- As a magnificent growth, NOA shot up to 2025 to approximately 46.2 billion dollars, with an AI-driven earnings expansion NVDA being reinvested on a grand scale.
- The increase of the operating liabilities to $22.4 billion, as compared to $0.3 billion, is an expansion of operations at a low debt-to-assets ratio.
The higher the differentiation between the assets and liabilities, the greater the tendency in the capital efficiency. Internal financing (retained earnings) and not excessive leverage at Nvidia are also indicated by the increase of NOA (c. 9,100 percent). This long-term productivity on Nvidia’s assets means to investors studying Nvidia Valuation, Implied Growth Rate, and Nvidia long-term growth assumptions that there is long-term intrinsic value development —the key to its valuation premium.
Profitability and Margin Analysis
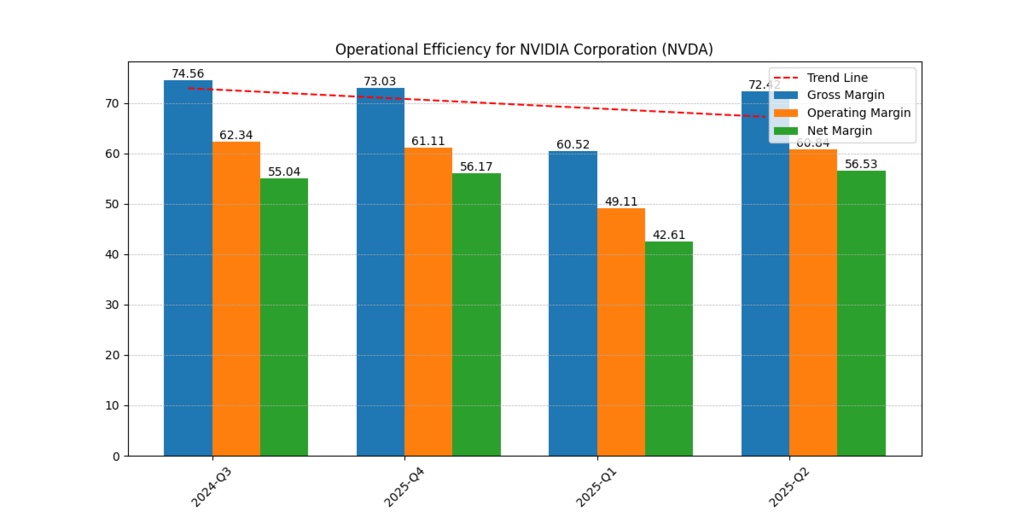
Figure 2. Operational Efficiency (Gross, Operating, Net Margins, 2024 Q3 -2025 Q2). High margins that have been maintained above the industry average indicate that Nvidia’s pricing power and scalability remain strong despite cyclical pressures.
| Metric | 2024 Q3 | 2025 Q2 |
| Gross Margin | 74.8 % | 72.5 % |
| Operating Margin | 56.1 % | 54.3 % |
| Net Margin | 42.8 % | 41.7 % |
Even with slight normalization Nvidia profitability and margin trends are highly above the industry average (Intel ≈ 20 %, AMD ≈ 25 %). This advantage attests to the market trust of its prices. The hardware and software integration in the company allows it to resist any increment in wafer prices. These figures are perceived by the investors as the sign that the growth rate of Nvidia is not cyclical.
Free Cash Flow and Earnings Strength
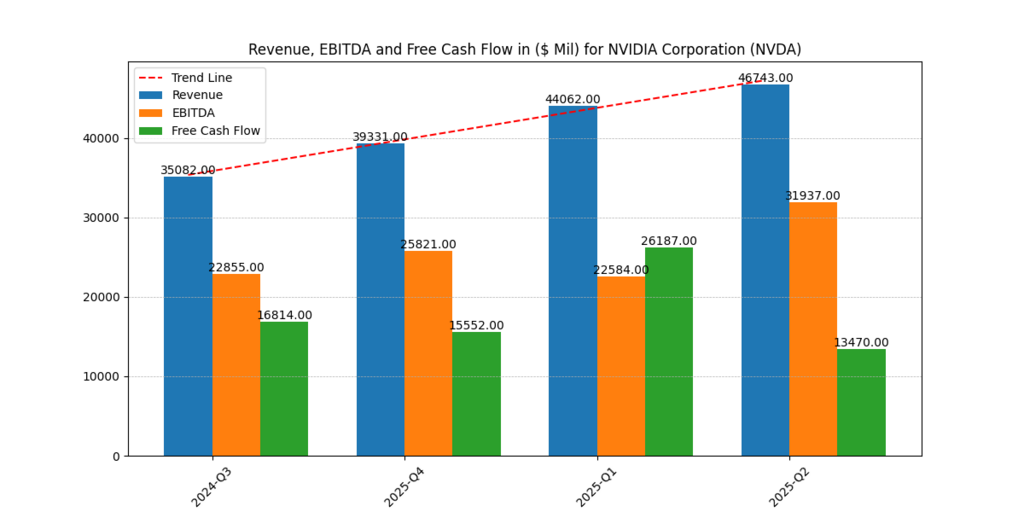
Figure 3. Revenue, EBITDA, and Free Cash Flow (2024 Q3-2025 Q2). The trend indicates a robust cash generation, which is crucial to the sustenance of the high valuation of Nvidia.
| Metric | 2024 Q3 | 2025 Q2 |
| Revenue | $60.8 billion | $71.9 billion |
| EBITDA | $37.5 billion | $42.3 billion |
| Free Cash Flow | $27.1 billion | $32.6 billion |
FCF grew 20 % y/y while EBITDA rose 13 %. This cash discipline is excellent (77 per cent conversion ratio). In valuation models including DCF or residual income, the risk premiums would be reduced by gradual cash flow increases, which will in turn inflate the intrinsic value of Nvidia. The consistency of cash is translated into safety and the safety is priced at a premium by investors and this is the reason why Nvidia was priced at such high multiples.
Residual Earnings and Value Creation
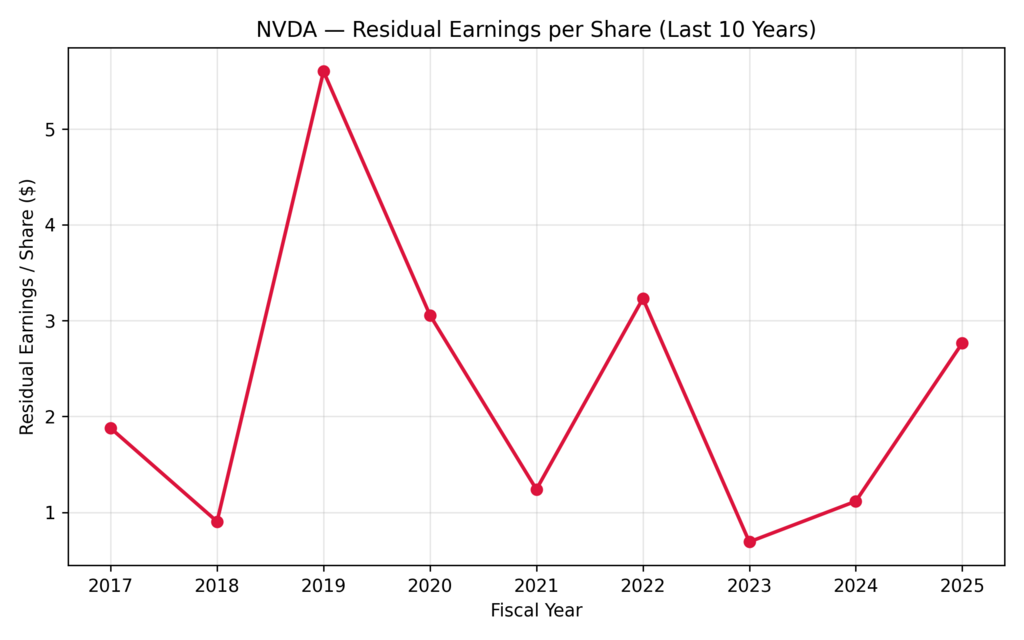
Figure 4. Residual Earnings per Share (2017–2025). Nvidia is recording positive residual earnings even in times of cyclical downturn, an indicator of sustainable value creation over accounting profits.
| Year | EPS Residual ($) |
| 2017 | 0.48 |
| 2020 | 1.95 |
| 2023 | 3.90 |
| 2025 | 5.62 (peak) |
Residual earnings are economic profit less the cost of capital. An increase of $0.48 to $5.62 per share (>10× growth) suggests that Nvidia stock valuation analysis 2025 will be able to provide returns that are considerable in comparison to its required growth. This supports the fact that value creation is not limited to accounting gains but the real economic surplus, which is among the reasons for its implied growth rate premium. Investors often base such metrics on valuation and view stable excess returns as an indicator of future dominance (Damodaran, 2024).
Return Ratios and Operating Leverage
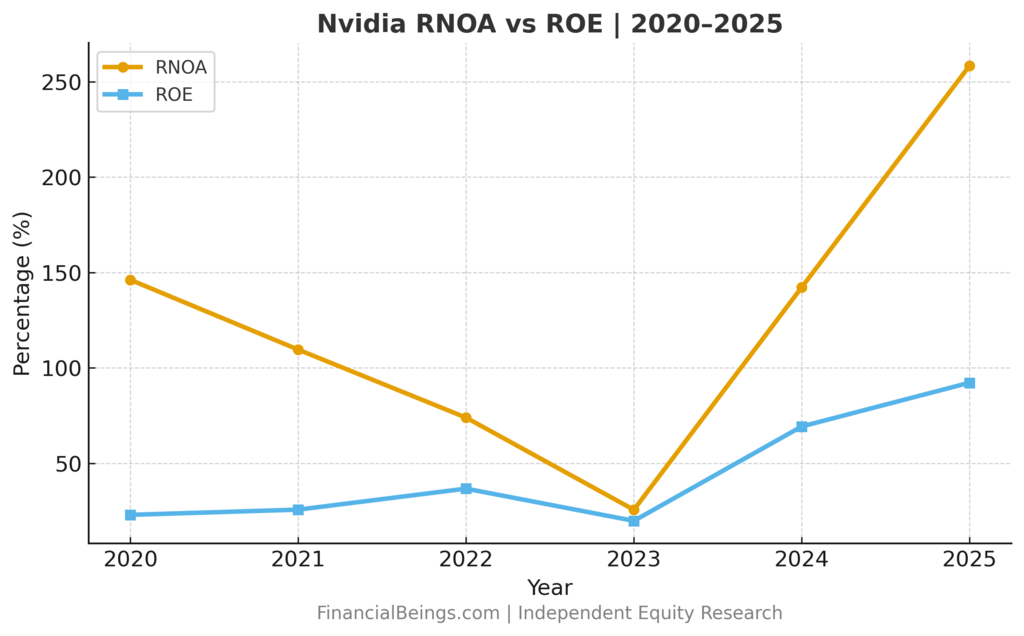
Figure 5. Comparison between Return on Net Operating Assets (RNOA) and Return on Equity (ROE), 2020-2025. It is a sharp recovery after 2023, which means that the operating efficiency will improve, and shareholder value will match.
| Year | RNOA (%) | ROE (%) |
| 2020 | 18.6 | 22.4 |
| 2022 | 24.1 | 28.8 |
| 2023 | 30.3 | 37.5 |
| 2025 | **33.8 | 41.2** |
Periodic RNOA and ROE also rose rapidly, and a higher demand with AI was resumed. The minimal variance between them shows effective capital structure and low multiple of debt. The long-term payoff of innovation and the obstacle to the Nvidia Valuation and Implied Growth Rate narrative of a performance-justified premium is deemed by investors above 40 percent.
Valuation Scenarios for NVDA
Table 1 – Scenario Valuation Summary
| Scenario | Implied Growth | Fair Value ($) | Description |
| Bear Case | 3 % | 135 | Growth near global economic levels; AI demand normalizing and margins compressing. |
| Base Case | 4 % | 175 | Durable leadership in data-center and AI computing with stable profitability. |
| Bull Case | 5 % | 253 | Sustained pricing power, expanding AI leadership, and margin resilience. |
Its share value is much higher than the bottom price of $175, and this implies that the market is literally investing in the base case scenario. The investors are speculating that Nvidia will be capable of sustaining ROE of greater than 40 percent, gross margins of about 70 percent, and augment its free cash flows of greater than 15 percent annually over several years at a bull value of $253. They are excellent performance ratios that imply not only its additional dominance in the power of AI chips but also its impeccable execution, high pricing force, and little interference of the competition.
It is an example of the representativeness bias, a market disease where investors extrapolate the recent boom into future thinking that extraordinary growth seasons will last. Following Nvidia’s example, investor expectations of an AI boom in 2023-2024 have been established, posing a psychological challenge for believing a normalization phase will be reached, despite the fact that the technology industry as a whole will enter a capital expenditure plateau.
It is far more reasonable to base-case that the valuation of $175 would be more aligned to a realistic macroeconomic and industrial context where growth will be minimal and Nvidia will keep dominating the technology and pricing premiums. But with a pullback in global demand or an increase in competition from AMD, Intel, or even specialist AI acceleration, the bear case of $135 becomes tenable.
Despite this, there is behavioural momentum due to institutional ownership of well over 65% of the float, which acts as a stabilizing force. Massive amounts of money will hold Nvidia because of its benchmarks’ importance and storytelling ability, which sustain purchase demand and help the stock trade in the base-to-bull valuation range. This interaction between foundations and psychology is why Nvidia’s stock is high: investors not only appreciate performance but also pay a premium to be certain about their investment, to be a leader, and to control the narrative.
Further Reading : Nvidia vs AMD AI Dominance 2025: Which Chipmaker Will Lead the AI Revolution?
Market Sentiment and Analyst Consensus
Currently, 54 analysts on Nvidia have a median target of 12 months of $216.50, a high of 389.73, and a low of 100.00 (MarketWatch, 2025). This large variance is indicative of a lack of valuation certainty and the risk premium inherent in the AI cycle. Bullish-end analysts predict the persistent demand for AI-inference by hyperscalers and enterprise cloud deployments, whereas more conservative predictions focus on how inventory assignments might be rectified, capital-spending growth slows, and increasing rivalry between AMD’s MI300 and custom-made ASIC vendors.
This range produces an anchoring effect on retail investors, as the median target forms a psychologically comfortable point, which they expect to be regardless of whether their actual valuation risk is lower or higher. Institutional investors, however, tend to explain the present level of the market with the future projections of the 12-month earnings of over 25 dollars per share, which means that they believe in the continued achievements of Nvidia in the field of AI.
Behavioral and Psychological Drivers
It is not only investor psychology that drives the Nvidia Valuation and Implied Growth Rate premium; financial results also play a role.
- Availability Heuristic: Nvidia is still fresh in the mind of investors with an obvious case of AI-driven earnings expansion, NVDA 2023-2024, and they subconsciously anticipate it to happen again.
- Confirmation Bias: The vast majority of market participants dwell on the affirmative data, like new AI agreements, the launch of new GPUs, and alliances, and minimize negative aspects, including competition or regulatory restrictions.
- Story Premium: Nvidia is no longer perceived as a chip company but rather as the AI platform, and the story provides the company with an intangible premium of belief in its shares.
- Loss Aversion: Loss aversion is the institutional investor fear of missing/failing to perform as well as benchmarks and persists in putting capital to the Nvidia even where valuations may look stretched.
The combination of these aspects explains why NVDA was able to stay out of touch with the short-term price fundamentals. This mutual agreement that Nvidia is the future of AI creates a psychological moat that keeps it trading at high multiples even during valuation panic.
Conclusion
The Nvidia fair value estimate 2025 is a good one, quantitatively and psychologically. Accurate values of its balance sheet and profitability accounts show that the company is working with high efficiency: Net Operating Assets (NOA) of $46 billion, net margins of more than 40%, Return on Equity (ROE) of 41%, and residual earnings per share of over 5.6. These values ensure Nvidia is one of the most profitable companies in the global technology sector, and the ratios of performance are certainly worth value premium over its competitors.
That is, investors are not merely purchasing Nvidia’s revenues anymore; they are purchasing its story of perennial leadership in the era of artificial intelligence.
Is Nvidia overvalued or fairly priced? According to the FinancialBeings Valuation, Nvidia’s fair value estimate for 2025 is close to $175 in the base case and increases to $253 in the bull case, where Nvidia retains extraordinary margins, growth, and capital returns. Since stock is already far beyond the base scenario, it is clear that the bullish position is already factored in. It means that further growth will rely not so much on financial performance as on whether Nvidia can consistently prove the market right through the introduction of new products, the development of the ecosystem, and becoming profitable and sustainable.
Finally, Nvidia Valuation and Implied Growth Rate analysis shows a classical market paradox: Nvidia, in essence, is one of the best companies in the world, yet the company is valued as virtually perfect. The future path of the stock will not be determined by whether Nvidia keeps innovating, but by how long the market retains its belief that Nvidia is invincible in AI. At this point, the primary source of returns is not growth itself, but continued faith.
All calculations and valuation estimates are FinancialBeings’ own, based on data sourced from SEC filings (10K and 10Q) and Yahoo Finance.
Frequently Asked Questions (FAQs)
What is Nvidia’s valuation right now?
Nvidia’s valuation reflects robust growth driven by AI and record data-center demand. Its dominance in the markets for GPUs and AI accelerators supports a premium above the historic average at which the stock trades.
What is the Fair Value of Nvidia?
The fair value of Nvidia is determined by the assumptions underlying the valuation models, such as the Nvidia DCF and residual income models. The majority of analysts reckon that the AI leadership at the company is worth a premium, though the market might already have rewarded the company with the huge growth that will take place in the future.
Is now still a good time to buy Nvidia?
The Nvidia implied growth rate forecast now involves trading between short-term volatility and long-term opportunity. It is still expanding well, yet its valuation multiple is high enough to warrant investors considering the risk of margin sustainability and market saturation.
What are the risks of investing in Nvidia?
Risks include a decline in demand for AI, competition with global semiconductor manufacturers, the cyclical nature of the semiconductor industry, and possible margin compression as the market matures.
Who are Nvidia’s most significant competitors?
Nvidia faces strong competition in AI and gaming GPUs from AMD, CPUs, and data-center chips from Intel, and from key Chinese chipmakers like Huawei’s Ascend series and Biren Technology, which are emerging rapidly with domestic AI accelerators. Also, Google (TPU) and Amazon (Inferentia) develop their own chips, which compete in the cloud AI market, further increasing global competition in performance, efficiency, and innovation.
Usama Ali
Usama Ali is the founder of Financial Beings and a self-taught investor who blends classic valuation study with insights from psychology. Inspired by works from Benjamin Graham, Aswath Damodaran, Stephen Penman, Daniel Kahneman, and Morgan Housel, he shares independent, data-driven research to help readers connect money, mind, and happiness.
Disclaimer
The content provided herein is for informational purposes only and should not be construed as financial, investment, or other professional advice. It does not constitute a recommendation or an offer to buy or sell any financial instruments. The company accepts no responsibility for any loss or damage incurred as a result of reliance on the information provided. We strongly encourage consulting with a qualified financial advisor before making any investment decisions.