Curious about where IBM is headed in 2025? From AI and hybrid cloud growth to dividend stability, what is IBM Stock Forecast 2025?
International Business Machines Corporation (IBM) is at a crossroads. Once viewed as a legacy technology company, IBM has been reinventing itself as a leader in artificial intelligence (AI), hybrid cloud, and enterprise consulting. 2025 is already shaping up to be a pivotal year, marked by the release of Watsonx AI and the acquisition of Red Hat. These are not symbolic rebranding efforts but organisational restructuring intended to open up new areas of revenue and decrease dependency on the slower-growth legacy operations.
The real issue that investors need to explore is not whether IBM can survive in a rapidly changing digital world, but whether it can scale to compete with hyperscalers like Microsoft Azure, Amazon Web Services (AWS), and Google Cloud. The difference of IBM is that it concentrates on regulated industries and enterprise-grade hybrid solutions, which provide the company with a niche position that balances stability and innovation.
This IBM Stock Forecast for 2025 is based on two key aspects: financial performance and investor psychology. On the financial front, IBM must demonstrate that it can maintain revenue growth, increase margins, and provide steady free cash flow to cover dividend payments, as well as investments in research and development. Psychologically, investors should be persuaded that the AI and cloud story at IBM is not a mere marketing effort, but rather a genuine source of growth that can drive share values upward.
This way, this article will assess how IBM can leverage AI and hybrid cloud innovation to maintain its reputation as a stable dividend payer, thereby positioning it uniquely in the tech-investment market.
Financial Backbone – Assets, Liabilities, and Stability
The assets-to-liabilities ratio of IBM has been reported to be between 1.22 and 1.25 over the past few months of 2024 and early 2025, indicating some level of balance sheet strength and indicating that the company has more assets than liabilities to meet its obligations (IBM, 2024). This stability demonstrates good financial discipline, implying that IBM has a sufficiently large cushion to absorb market fluctuations in the short term or an increase in interest rates.
The situation, however, becomes more complicated when tangible assets are factored in. The net tangible assets to net liabilities ratio have been below the line, ranging between -0.40 and -0.43, indicating IBM’s reliance on intangible assets, such as goodwill, patents, proprietary software, and intellectual property. This dependency is partly due to IBM’s acquisitive approach, particularly its acquisition of Red Hat, and its shift to service-based and knowledge-based revenue models, where intangible resources play a primary role in establishing value.
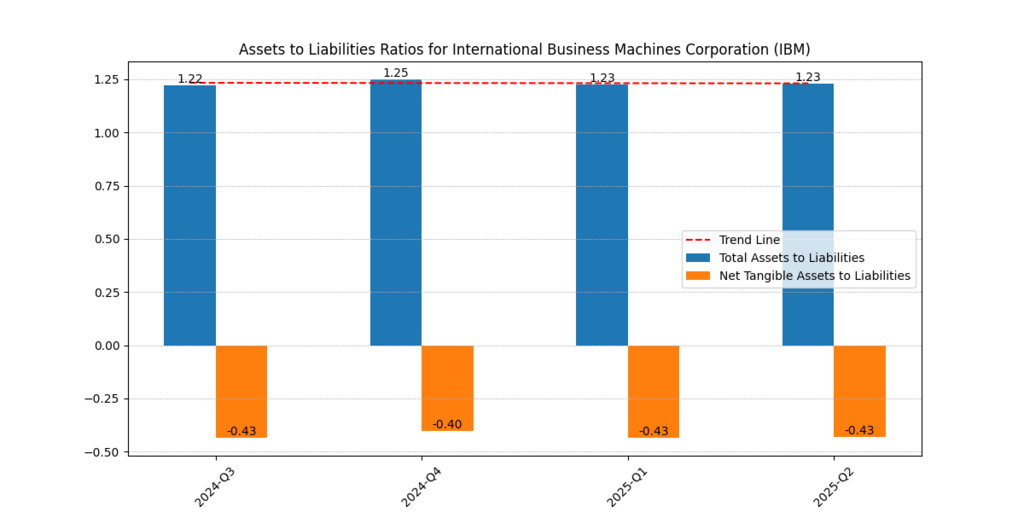
Figure 1. Assets to Liabilities Ratios for IBM (2024–2025). IBM’s asset-to-liability stability alongside negative net tangible backing.
| Quarter | Total Assets to Liabilities | Net Tangible Assets to Liabilities |
| 2024 Q3 | 1.22 | –0.43 |
| 2024 Q4 | 1.25 | –0.40 |
| 2025 Q1 | 1.23 | –0.43 |
| 2025 Q2 | 1.23 | –0.43 |
Whereas conservative investors are likely to be alarmed by negative tangibles, growth-oriented investors tend to view robust intangible portfolios as a source of innovation in the future (Penman, 2013).
Cash Flow and Expenditure Discipline
Cash flow-to-expenditure ratios have fluctuated sharply:
- Q3 2024: 6.79
- Q4 2024: 9.75
- Q1 2025: 11.06
- Q2 2025: 4.56
| Quarter | Cash Flow to Expenditures |
| 2024 Q3 | 6.79 |
| 2024 Q4 | 9.75 |
| 2025 Q1 | 11.06 |
| 2025 Q2 | 4.56 |
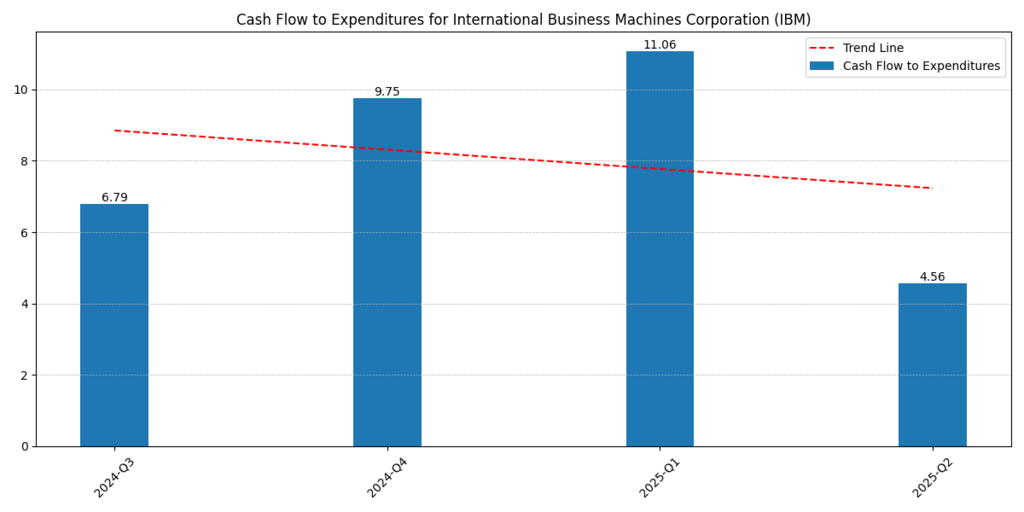
Figure 2. Cash Flow to Expenditures for IBM (2024–2025).
As Figure 2 illustrates, although IBM exhibits a high cash discipline in late 2024 and early 2025, the Q2 dip is a concern due to its sustainability. The steep decline from 11.06 in Q1 2025 to 4.56 in Q2 2025 is an indication that cyclical demand forces, increased reinvestment in AI and cloud infrastructure, or changes in the timing of expenditure may be stretching the company’s capabilities to generate free cash compared to its consistent spending. The behavioural finance view of this ratio is that volatility will disproportionately affect sentiment, as investors assume consistency is associated with lower risk and inconsistency is linked to increased uncertainty (Kahneman, 2011).
Coverage Ratios and Debt Handling
The debt coverage ratios of IBM have also increased, reflecting the enhanced financial strength and improved operational recovery. EBIT coverage, the company’s capacity to repay interest on operating profits, rose to 6.09 in Q2 2025, compared to -0.87 in Q3 2024, indicating a significant improvement in earnings. Likewise, the EBITDA coverage has increased from 2.09 to 8.57 during the same period, highlighting that IBM can cover its debt provided there are no non-cash items, such as depreciation and amortisation. These gains indicate that IBM has not only managed to stabilise its income but also to increase its ability to cope with financial commitments and implement strategic investments.
To investors, higher coverage ratios mean that investors have less to worry about in the event of a default or dividend reduction; the confidence in IBM’s balance sheet is strengthened as a component of the overall IBM Stock Forecast 2025.
| Quarter | EBIT Coverage | EBITDA Coverage |
| 2024 Q3 | –0.87 | 2.09 |
| 2024 Q4 | 8.80 | 11.42 |
| 2025 Q1 | 3.55 | 6.13 |
| 2025 Q2 | 6.09 | 8.57 |
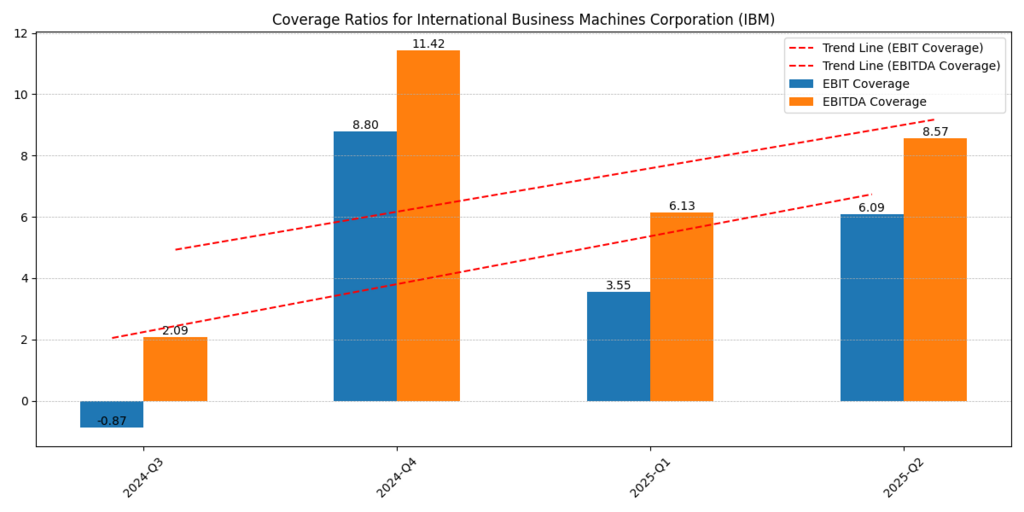
Figure 3: EBIT and EBITDA Coverage Ratios for IBM (2024–2025). Highlights the improving trend in IBM’s debt servicing ability.
It can better cover, and the investors can be assured since the ability to handle debt burdens reduces the perceived risk (Barberis & Thaler, 2003).
Dividend Policy and Yield Stability
IBM continues to attract income-seeking investors with its steady policy of dividends, which has been one of the primary pillars of its appeal, regardless of fluctuations in earnings growth rates. Its dividend per share has been steadily increasing, and currently, the dividend per share is $6.64 in 2024, with a dividend per share of $6.54 in 2021. This demonstrates that management took the commitment of shareholders seriously, even during the restructuring of their company.
At the same time, the dividend yield has stabilised within a narrow band of 3.03%-3.08%, providing investors with a steady stream of income in addition to potential capital gains at a later point. Such stability in dividends in both instances of the IBM Stock Forecast 2025 not only gives IBM a good reputation as a reliable income stock, but it also sets a psychological anchor for investors, whereby the risk factor is minimised and confidence in the company’s long-term stance is increased.
| Year | Dividend per Share (USD) | Dividend Yield (%) |
| 2021 | 6.54 | 3.03 |
| 2022 | 6.56 | 3.05 |
| 2023 | 6.60 | 3.06 |
| 2024 | 6.64 | 3.08 |
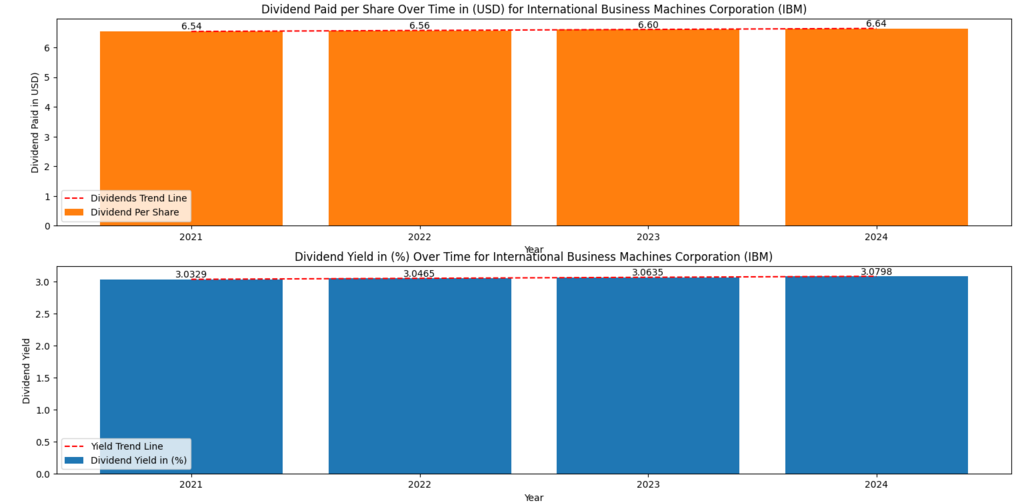
Figure 4: Dividend per Share and Yield for IBM (2021–2024). It shows IBM’s steady dividend payouts and yield trend.
The psychological anchors that dividends bring to the mind of investors give strength to the dividend aristocrat, which is the psychological stability of IBM (Lintner, 1956).
Operational Efficiency – Margins Analysis
IBM has a somewhat mixed operational performance, with gross margins remaining stable at 55-59%, indicating that the firm continues to derive good core profitability from its products and services. Nevertheless, both the operating and net margins have been even more erratic, as the operating margins have ranged from 12.14% to 22.22%, and the net margins have ranged from -2.20% to 16.60%. This volatility reflects the expenses of the current transformation, which includes high investments in AI and hybrid cloud, integration, and reorganisation of the existing business.
Although short-term fluctuations in margin can cause some uncertainty, the inherent strength in gross margins indicates that IBM has a strong base that can absorb costs and gradually normalise its profitability. For investors, judging the IBM Stock Forecast 2025, this suggests that short-term volatility may be the price of long-term strategic positioning and does not necessarily signal structural weakness.
| Quarter | Gross Margin (%) | Operating Margin (%) | Net Margin (%) |
| 2024 Q3 | 56.25 | 14.55 | –2.20 |
| 2024 Q4 | 59.47 | 22.22 | 16.60 |
| 2025 Q1 | 55.23 | 12.14 | 7.26 |
| 2025 Q2 | 58.76 | 18.18 | 12.92 |
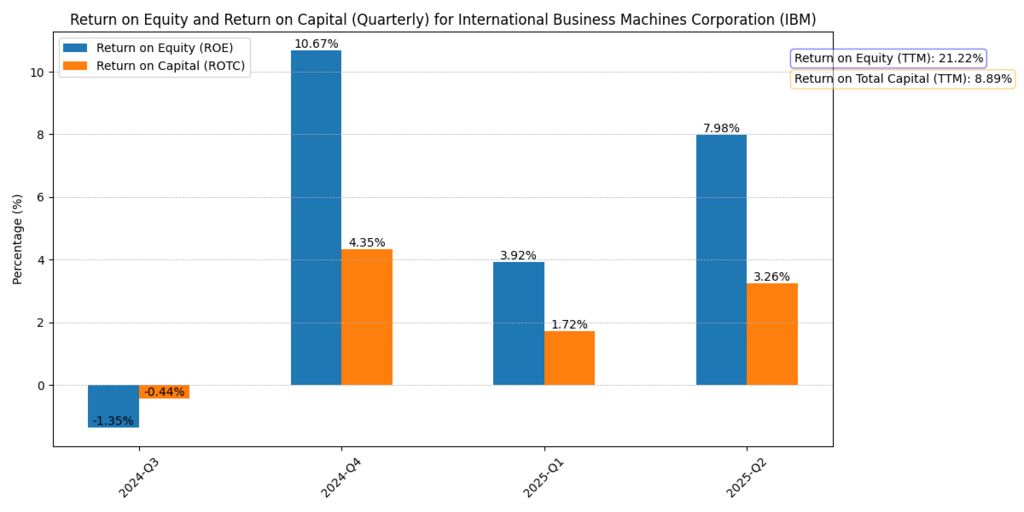
Figure 5. Gross, Operating, and Net Margins for IBM (2024–2025). It visualises IBM’s margin efficiency.
This up-and-down movement demonstrates that IBM is still in the process of switching to AI and cloud services. This can be interpreted as a sign of strategic change rather than instability for long-term investors (IBM, 2024).
Revenue, EBITDA, and Free Cash Flow
The revenues and the EBITDA levels of IBM present the overall improvement:
- Revenue will have a high point of $17,553M in Q4 2024, and an even point of $16,977M in Q2 2025.
- EBITDA rose from $895M in Q3 2024 to $4,372M in Q2 2025.
- The free cash flow was also better, though volatile, indicating the seasonality of business operations.
| Quarter | Revenue ($M) | EBITDA ($M) | Free Cash Flow ($M) |
| 2024 Q3 | 14,967 | 895 | 2,457 |
| 2024 Q4 | 17,553 | 4,843 | 3,886 |
| 2025 Q1 | 14,541 | 2,790 | 3,975 |
| 2025 Q2 | 16,977 | 4,372 | 1,328 |
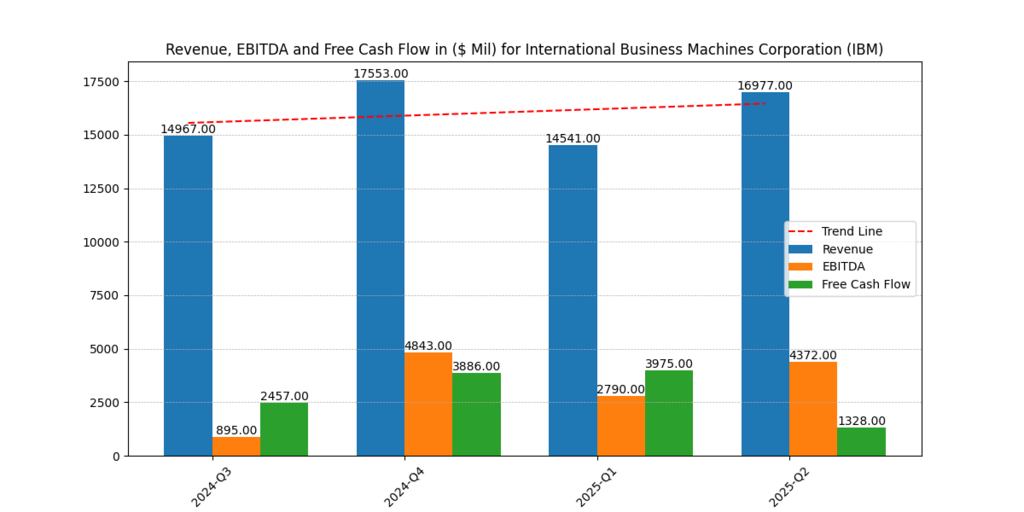
Figure 6 highlights IBM’s revenue and cash flow recovery.
Return on Equity (ROE) and Return on Capital (ROTC)
The profitability measures of IBM indicate both short-term variations and long-term robustness. Return on equity (ROE) ranged between -1.35% and 10.67% every quarter, indicating fluctuations in earnings as the company invested in AI and hybrid cloud following the restructuring of its old operations. Irrespective of these fluctuations, the trailing twelve-month (TTM) ROE is a healthy 21.22%, indicating that, in a longer-term perspective, IBM is realising healthy returns compared to its shareholder equity. Equally, the return on the total capital (ROTC), which considers equity and debt, also rose to 3.26% in Q2 2025 with a TTM rate of 8.89%, indicating that the firm is slowly becoming efficient at utilising its total capital base.
To anyone who is thinking about the IBM Stock Forecast 2025, these values suggest that the volatility of the company in the short run might cause a tremor in the market of short-term traders. Still, the long-term profitability trends that IBM has are strong enough to give confidence to those interested in long-term value creation.
| Quarter | Revenue ($M) | EBITDA ($M) | Free Cash Flow ($M) |
| 2024 Q3 | 14,967 | 895 | 2,457 |
| 2024 Q4 | 17,553 | 4,843 | 3,886 |
| 2025 Q1 | 14,541 | 2,790 | 3,975 |
| 2025 Q2 | 16,977 | 4,372 | 1,328 |
Figure 7 shows IBM’s improving equity and capital returns.
ROE is a more than effective performance proxy that investors tend to anchor on psychologically, and which supports positive sentiment in the face of less impressive ROTC (Barberis and Thaler, 2003).
Valuation Models: Value-Added Earnings and Growth Scenarios
The VAE framework reveals significant upside potential compared to market expectations.
| Scenario | Growth Price per Share (USD) | Implied Growth Rate (%) | VAE (2025, USD) |
| No Growth | 118.15 | 0.00 | 8.16 |
| Growth @ 8% | 269.57 | 9.12 | 8.16 |
| Growth @ 8.5% | 295.73 | 9.12 | 8.16 |
| Growth @ 9% | 327.95 | 9.12 | 8.16 |
IBM is underpriced on its growth prospects since, at the present price of $248.63, it is traded at a lower valuation than model growth valuations, indicating that the market is under-pricing its long-term growth potential. The market-implied growth rate (5.71%) stands considerably below the model’s 9.12%, providing an opportunity for contrarian investors (Penman, 2013).
Further Reading : Nvidia Stock Prediction 2030 after Q2 2026 Earnings: Should You Buy the Stock?
Conclusion – Is IBM a Good Stock to Buy in 2025?
The IBM Stock Forecast 2025 identifies the company as having two distinct aspects: a consistent dividend payer and a growth stock driven by innovation. The coverage ratios, ROE, and dividends indicate that it is resilient, whereas investments in AI and hybrid cloud suggest that it has a growth momentum.
To the conservative investor, the dividend will be reassuring to IBM. To growth investors, the valuation models indicate undervaluation compared to intrinsic value. Therefore, IBM is a safe anchor and contrarian AI bet.
Usama Ali
Usama Ali is the founder of Financial Beings and a self-taught investor who blends classic valuation study with insights from psychology. Inspired by works from Benjamin Graham, Aswath Damodaran, Stephen Penman, Daniel Kahneman, and Morgan Housel, he shares independent, data-driven research to help readers connect money, mind, and happiness.
Disclaimer
The content provided herein is for informational purposes only and should not be construed as financial, investment, or other professional advice. It does not constitute a recommendation or an offer to buy or sell any financial instruments. The company accepts no responsibility for any loss or damage incurred as a result of reliance on the information provided. We strongly encourage consulting with a qualified financial advisor before making any investment decisions.