Introduction
Tesla and BYD are considered the best EV stocks by the investors. Let’s delve into the financial measures such as revenues, market valuation, free cash generated and profit margins to help you make your investment decision.
The increasing move toward clean transport has caused investors from all over the world to pay close attention to electric vehicle companies. In this rapidly developing industry, BYD Company Ltd. (BYDDF) and Tesla Inc. (TSLA) are two major companies at the forefront of new technologies, manufacturing and expanding their market reach. You need to look closer than just the brand name when deciding on which EV stocks to select.
People who invest should analyze a business’s earnings, how well it manages day-to-day operations, its cash flow condition and its worth. In this article, we make use of data to show how BYD and Tesla differ in the electric vehicle space, so you know which company has the best prospects for future growth.
Financial Analysis: Comparative Review of BYD vs Tesla
When evaluating the best EV stocks, a deep dive into financial metrics is crucial. Comparing BYD (BYDDF) and Tesla (TSLA) across key financial indicators reveals distinct strengths and weaknesses that may guide investor decisions.
Profitability
Tesla is more profitable than BYD overall. Tesla’s performance on its Return on Sales, at 7.3%, Return on Assets (ROA) at 5.84% and Net Margin of 7.3%, exceeds BYD’s rate of 5.18%, but the trend is going downwards due to Tesla’s sales decline.
BYD excels at Return on Equity (ROE) at 21.73%, more than double Tesla’s 9.78% which is due to BYD having more borrowed money (4.23 vs. 1.67).
Therefore, the company’s profit on each dollar of shareholder equity is higher, but it has a higher risk from debt. By comparison, BYD’s ROC and ROTC are 12.77% and 21.59%, respectively, as opposed to Tesla’s 8.21% and 10.76%. They demonstrate that BYD is good at using its finances and performing well in the capital-heavy EV business. [1]
Operational Efficiency
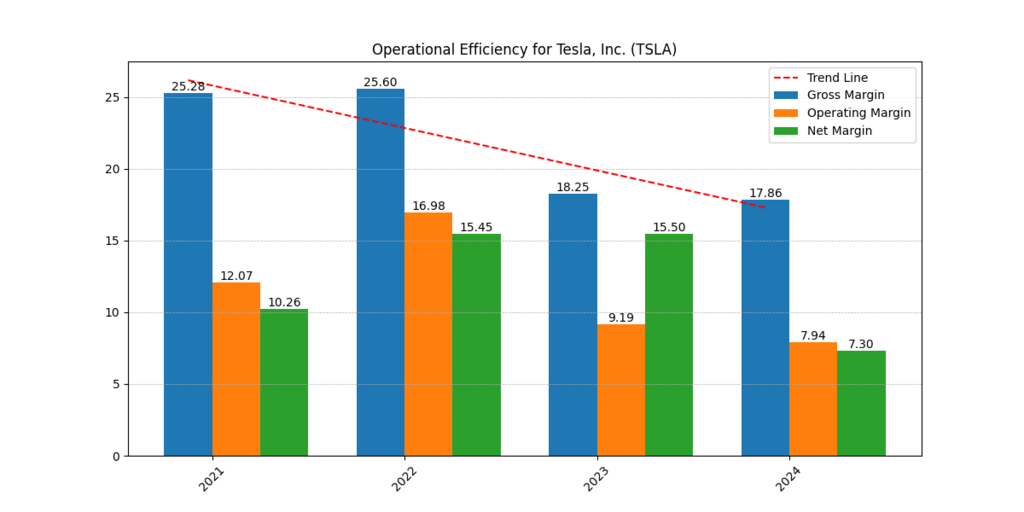
On Asset Turnover, BYD is ahead again by delivering 0.99 which outpaces Tesla at 0.8, suggesting that BYD generates greater revenue for every dollar spent on assets. Tesla has a slightly better Operating Margin (7.94% as compared to BYD’s 7.0%) which demonstrates a better control of daily operations.
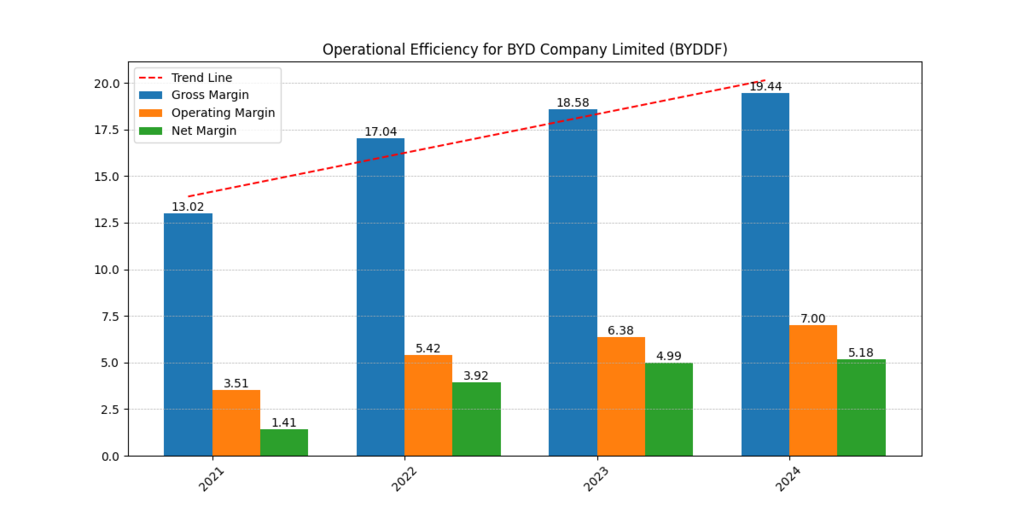
When looking at Gross Margin, BYD (19.44%) is better than Tesla (17.86%) which indicates BYD uses its resources and manages production more efficiently. Even more impressive is that BYD earns such profits while being involved in both the EV and battery manufacturing spaces, as these are often not very profitable.
Valuation Metrics
Its P/E ratio is around 196 which indicates that its stock price is valuing robust growth to come. At a 27.65 P/E, BYD is less expensive than TESLA which may mean it is going unnoticed or is actually undervalued compared to its earnings.
The EV/EBITDA ratio demonstrates the margin between the companies: Tesla has a ratio of 75.58x while BYD has a ratio of 1.82x. This makes it clear that Tesla is valued more highly which might stop value investors from being interested, despite its strong brand and presence worldwide.
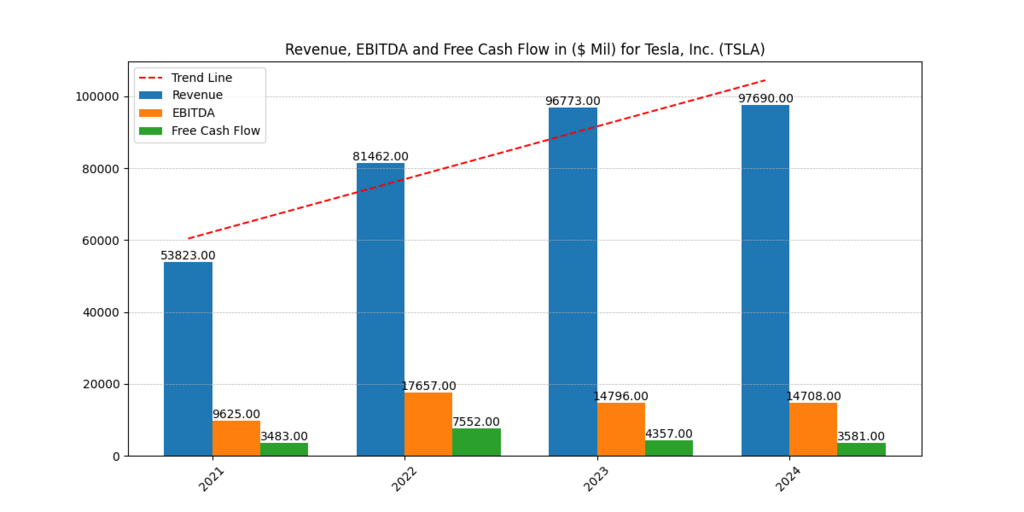
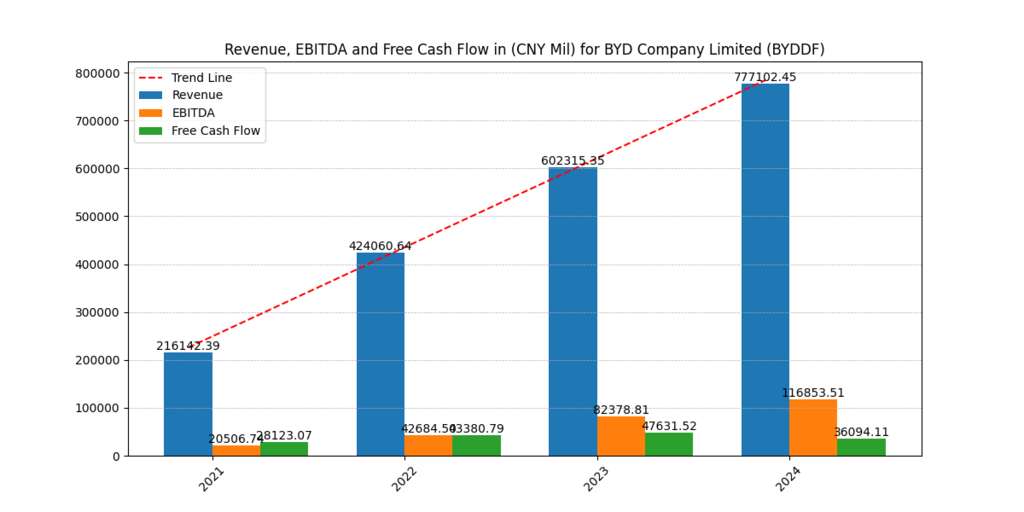
BYD reports Free Cash Flow to Equity (FCFE) of $30.72 billion, much higher than Tesla’s $29.1 billion and also leads in Free Cash Flow to Firm (FCFF) with $15.95 billion to Tesla’s $15.5 billion. They prove that BYD is strong financially and can access money from inside the company as needed. [2]
Each company’s high Equity Ratio shows they have little exposure to debt, with Tesla leading at 84.88% and BYD following at 82.85%.
Cash Flow and Capital Strength
BYD records much higher Free Cash Flow to Equity (FCFE) of $221.3 billion, compared to Tesla’s $29.1 billion and also holds the top spot for Free Cash Flow to Firm (FCFF) at $114.9 billion, compared to Tesla’s $15.5 billion. They prove that BYD has strong internal funds and can change or adapt its financial arrangements with ease.
Tesla and BYD have strong Equity Ratios of 84.88% and 82.85% respectively, meaning they are financially stable and rarely need debt.
Enterprise Value and EBITDA
BYD’s Enterprise Value is just $212.96 billion compared to Tesla’s huge $1.11 trillion, reflecting where the market sees these two companies. Even though Tesla sells for more on the stock market, BYD produces much higher EBITDA, demonstrating how strong the company is.
Conclusion: Which is the Best EV Stock?
Choosing the best EV stock depends on your investment strategy:
- Growth-Oriented Investors: Tesla may be more appealing due to its brand power, operational margins, and market dominance—though it comes at a steep valuation.
- Value and Efficiency Investors: BYD stands out with better ROC, EBITDA, free cash flow, and more reasonable valuation ratios. It may represent a more grounded and efficient EV player.
In summary, BYD offers strong financials, impressive capital efficiency, and value, while Tesla provides better margins and brand-driven growth prospects. Depending on your risk tolerance and investment goals, either could be the right pick—but BYD might just be the more balanced bet among the best EV stocks.
Disclaimer
The content provided herein is for informational purposes only and should not be construed as financial, investment, or other professional advice. It does not constitute a recommendation or an offer to buy or sell any financial instruments. The company accepts no responsibility for any loss or damage incurred as a result of reliance on the information provided. We strongly encourage consulting with a qualified financial advisor before making any investment decisions.