Introduction
Which stock returns of APA vs. ConocoPhillips (COP) will be better in 2025? Find out revenue, profitability, quality of dividends, and values to identify the more brilliant energy investment opportunity. The energy business globally remains a long-term value investment, as it has served as the basis for industrialization and portfolio diversification. Although the oil industry is cyclical, and the world is slowly transitioning to renewable energy, APA Corporation (APA) and ConocoPhillips (COP) are still good places to invest in because of their high cash flow, constant dividends, and strong balance sheets. They are robust in coping with market changes and adapting to the new economics of production, which makes them among the best investors in the energy industry under discussion.
This is a comparative analysis of the APA vs. ConocoPhillips (COP) case to determine which oil stock is the most valuable in 2025. The analysis measures the liquidity, profitability, dividends, and operational efficiency through financial graphics, valuation analysis, and key performance indicators. The evaluation encompasses professional analytics and behavioural finance.
Oil and gas equities are not necessarily financial, but it is highly influenced by investor perception and sentiment. The investment behaviour is anchoring bias: individuals are generally too sensitive to past prices, previous dividend rates, or brand recognition when making investment decisions. To illustrate, the consistency of the COP share price and high dividends will be perceived by the long-term shareholders as an indicator of stability, which will underpin its image as a blue-chip energy share. On the other hand, contrarian investors would consider APA as a relatively low-priced stock and take a chance to get undervalued returns, which would be psychologically attractive in terms of the search for the next turnaround narrative.
Financial Position: Assets and Liabilities Comparison
The ratio of assets to liabilities is a very important measure of a company’s leverage and its ability to settle its debts, thereby creating corporate stability.
Figure 1 below shows the concave plot of ConocoPhillips’s (COP) Assets-to-Liabilities Ratios. COP has a good balance sheet whereby total assets to liabilities increased by 2.07 in Q3 2024 into 2.15 in Q2 2025. The balance sheet also showed that it has been able to manage its assets, and its net tangible assets to liabilities ratio increased slightly from 1.07 to 1.15.
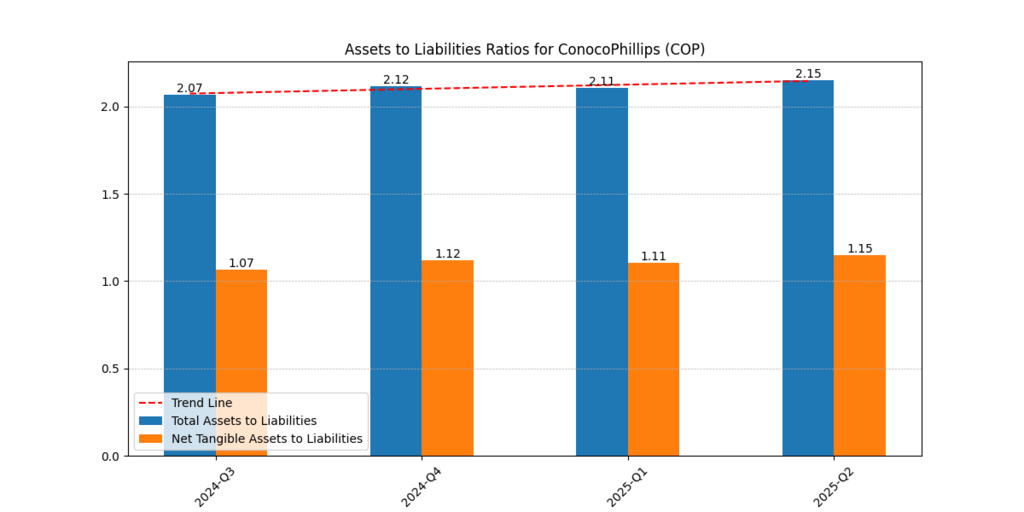
Figure 1: Assets-to-Liabilities Ratios for ConocoPhillips (COP)
Conversely, APA Assets-Liabilities Ratios grew by 1.47 between Q3 2024 and Q2 2025, but net tangible assets to liabilities grew by 0.39 to 0.53. Even though the APA ratios are lower than the COP ratios, the growth indicates better financial discipline.
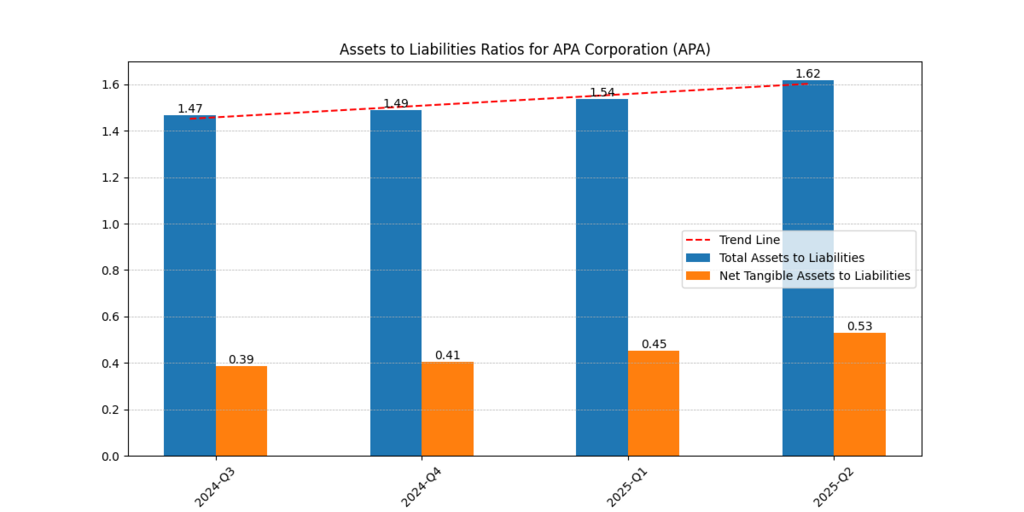
Figure 2: Assets-to-Liabilities Ratios for APA Corporation (APA)
| Company | Period (2024–2025) | Total Assets to Liabilities | Net Tangible Assets to Liabilities |
| ConocoPhillips (COP) | Q3 2024 – Q2 2025 | 2.07 → 2.15 | 1.07 → 1.15 |
| APA Corporation (APA) | Q3 2024 – Q2 2025 | 1.47 → 1.62 | 0.39 → 0.53 |
The ratios in COP are more general, indicating greater financial stability. APA is a moderately leveraged firm, but it is improving. Conversely, risk-averse investors would prefer the balance sheet of COP over APA, as the latter has improving leverage (a value opportunity) in the view of contrarian or risk-taking investors (Morningstar, 2024).
Profitability and Operational Efficiency
Operational efficiency indicates a firm’s capacity to convert revenue into profit. Figure 3 illustrates COP’s gross, operating, and net margins. The gross margins of COP were approximately 28-31%, the operating margins were 18-25% and the net margins were 14-17%. The minor decline is a pointer to a slight cost pressure and to maintained profitability.
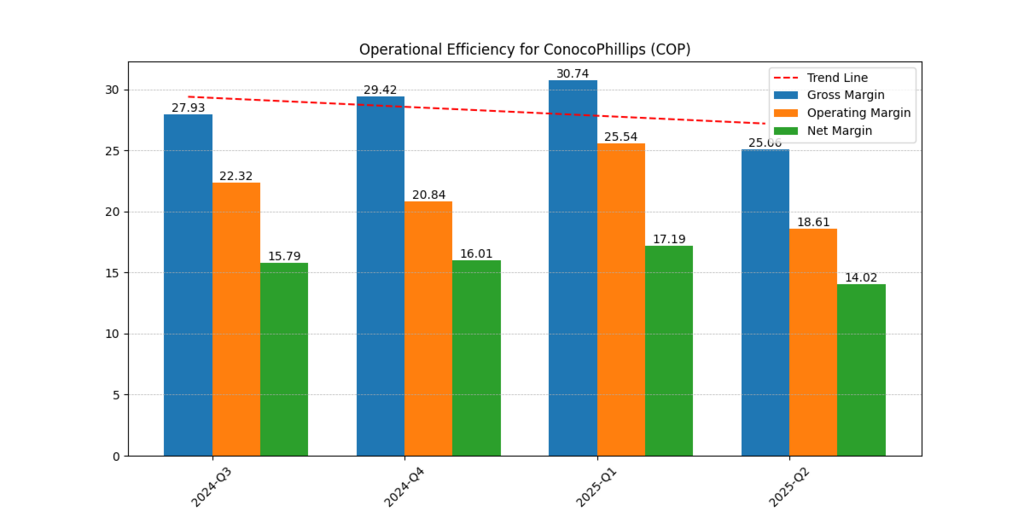
Figure 3: Operational Efficiency for ConocoPhillips (COP)
Likewise, Figure 4 shows the Operational Efficiency of APA, with gross margins ranging between 38-44%, operating margins from 29-35%, and net margins of 27.7%, which have rebounded from a strong negative of -8.8% in 2024 Q3 to 27.7% in 2025 Q2.
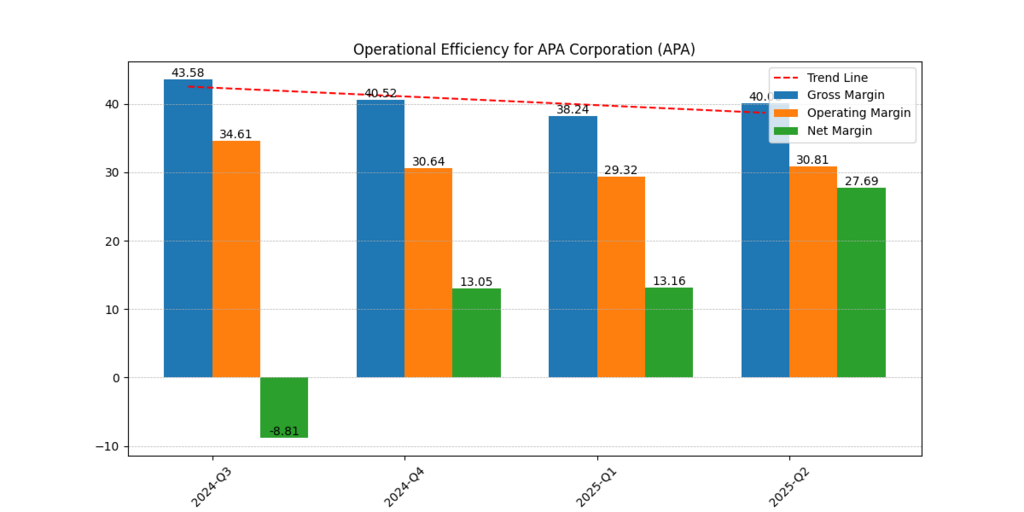
Figure 4: Operational Efficiency for APA Corporation (APA)
| Metric | COP (Avg.) | APA (Avg.) | Trend |
| Gross Margin | ~28.8% | ~40.0% | APA higher |
| Operating Margin | ~21.6% | ~31.0% | APA higher |
| Net Margin | ~15.3% | ~11.8% (improving) | COP more stable |
Although APA has been improving its gross and operating margins, COP is more attractive to conservative investors because of its stable, predictable margins. Consistency is usually more important than short-term performance peaks, as evidenced in analyses of oil stock valuation 2025 (Reuters, 2025).
Revenue, EBITDA, and Cash Flow Dynamics
Revenue trends are first-hand information on the possibility of corporate growth.
Figure 5 represents the Revenue, EBITDA, and Free Cash Flow (FCF) of COP. COP increased its revenue by $13.0 billion in Q3 2024, then slightly adjusted to $16.5 billion in Q1 2025, and then to $14.0 billion by the 2nd quarter of 2025. EBITDA also followed a similar trend, rising from $5.9 billion to $7.6 billion and then leveling off at $6.2 billion.
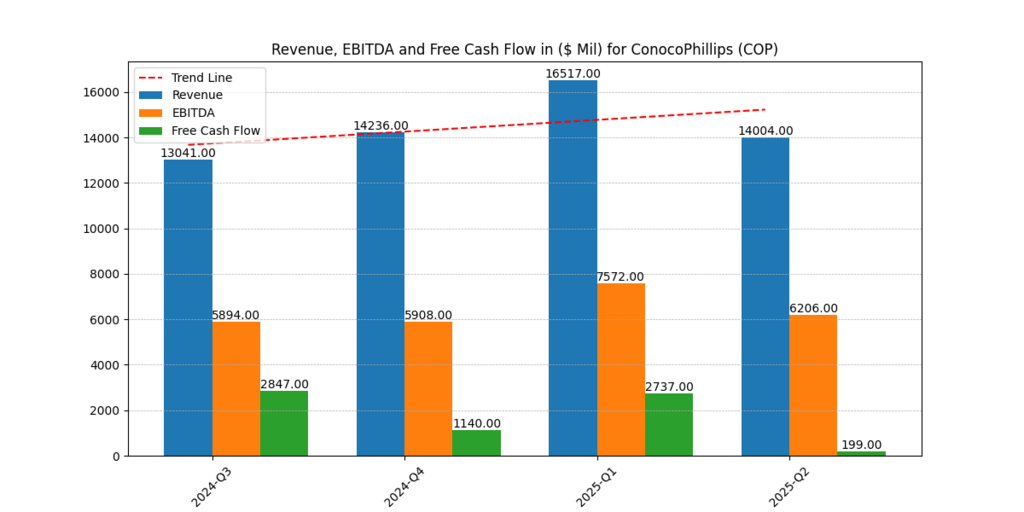
Figure 5: Revenue, EBITDA, and Free Cash Flow for ConocoPhillips (COP)
In the case of APA, Figure 6 shows that revenue will be the highest at $2.7 billion in Q4 2024, then decrease to $2.2 billion in Q2 2025. There was, however, an excellent recovery in EBITDA, which had started declining in Q3 2024 and reached its highest level in Q2 2025, growing by $356 million to $1.6 billion.
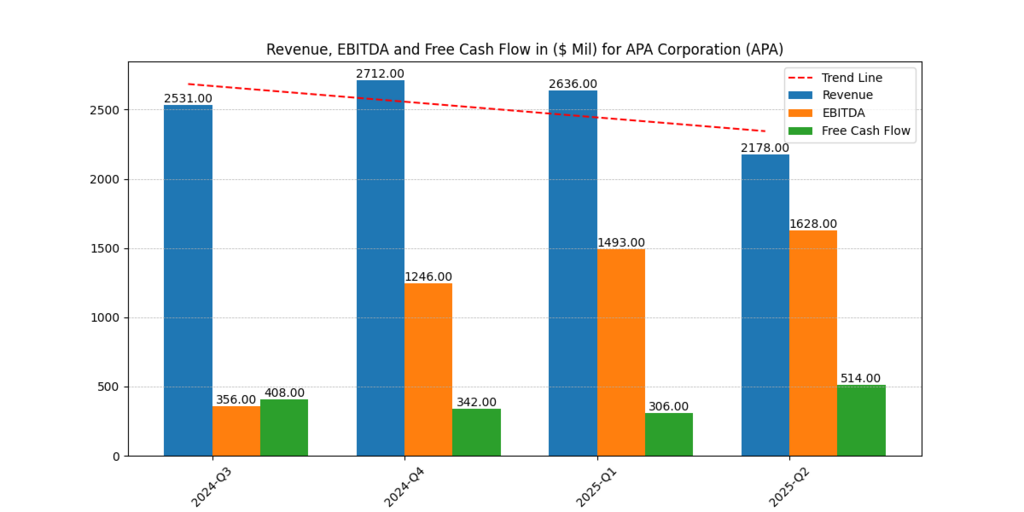
Figure 6: Revenue, EBITDA, and Free Cash Flow for APA Corporation (APA)
| Company | Revenue Range (in $ billion) | EBITDA Range (in $ billion) | FCF Trend |
| ConocoPhillips (COP) | 13.0 – 16.5 | 5.9 – 7.6 | Volatile but positive |
| APA Corporation (APA) | 2.2 – 2.7 | 0.4 – 1.6 | Strong upward recovery |
The rapid EBITDA growth indicates APA’s effective cost optimization and asset reallocation. The consistent numbers of COP indicate operational maturity. In terms of the energy sector investment opportunities, APA could be attractive to momentum investors, but COP fits the income-based portfolios (Bloomberg, 2025).
Dividend Performance and Yield Strength
The focus of the APA vs. ConocoPhillips (COP) stock outlook 2025 is on dividend sustainability. The two companies have a stable payout to shareholders.
The dividend per Share (DPS) and dividend yield comparison APA COP were strong. DPS ranged from $1.81 to $4.74 in 2021 and 2023, respectively, and corrected to $2.86 in 2024. This was reflected in the dividend yield, which averaged 3-5%, showing that COP has a strong income profile.
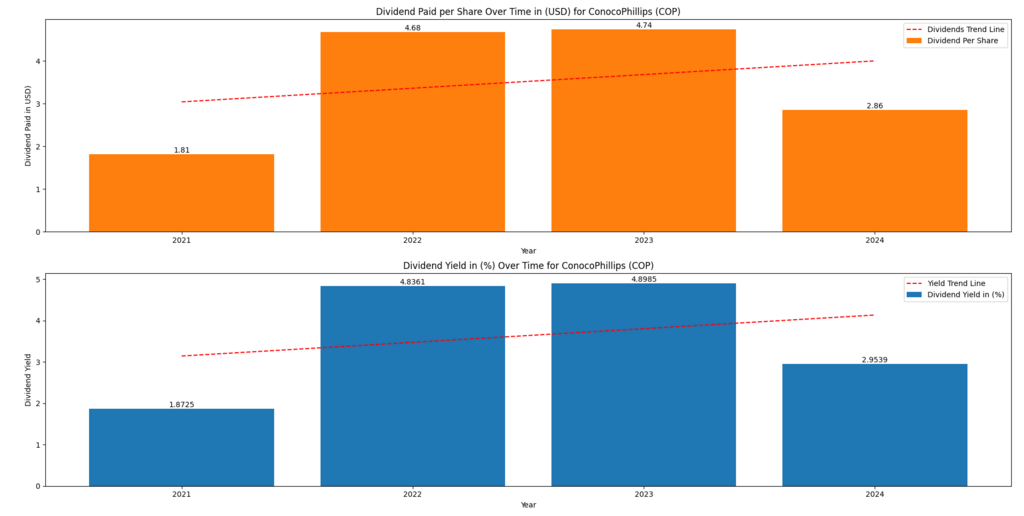
Figure 7: Dividend Paid per Share and Dividend Yield for ConocoPhillips (COP)
The growth in dividends at APA, as presented in Figure 8, increased significantly from 2021 ($0.15) to 2023 ($1.01) and then decreased slightly in 2024 ($0.97). Its yield also increased to 4.57% from 0.68%.
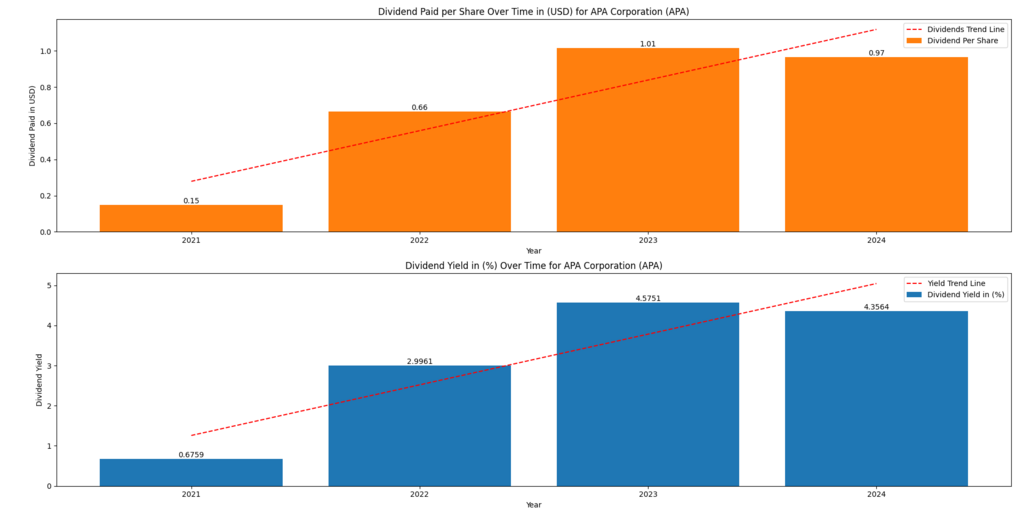
Figure 8: Dividend Per Share and Dividend Yield for APA Corporation (APA)
| Company | Dividend per Share (USD, 2021–2024) | Average Yield (%) | Trend |
| ConocoPhillips (COP) | 1.81 → 4.74 → 2.86 | 3.9 | Stable with mild correction |
| APA Corporation (APA) | 0.15 → 1.01 → 0.97 | 3.2 | Rapid growth |
The dividends of COP are more predictive and stable, making it a good choice for investors who value predictability. The increasing yield of APA is short-term excitement with increased volatility. According to behavioral finance theory, income investors exhibit recency bias, which tends to overrate current dividend growth.
Coverage Ratios and Free Cash Flow Discipline
The APA’s EBIT and EBITDA coverage ratios have increased from -2.37 in Q3 2024 to 15.69 in Q2 2025, and from 3.52 to 23.26, respectively. These huge gains reflect on rising debt service ability.
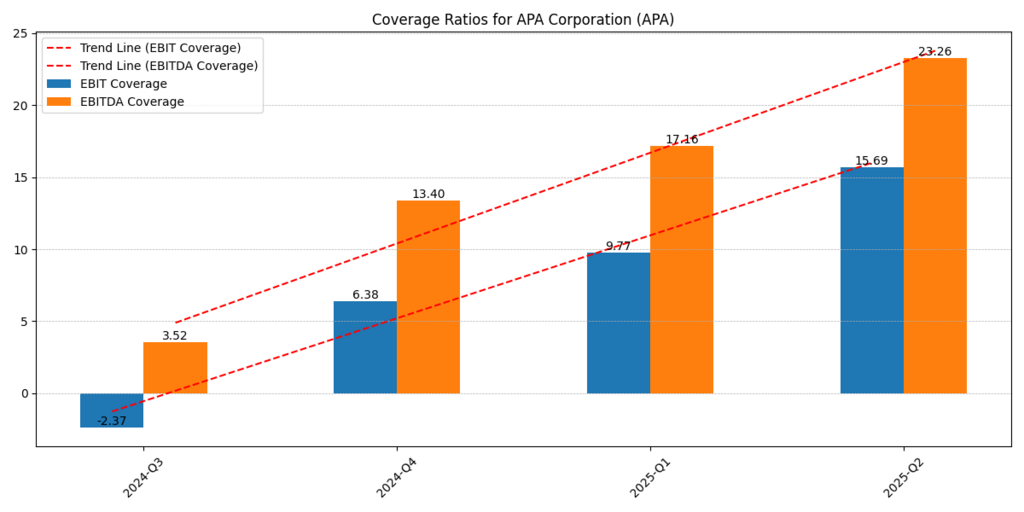
Figure 9: Coverage Ratios for APA Corporation (APA)
Besides, the (Dividends to Free Cash Flow Ratio) indicates that APA paid out dividends, increasing by 29.7 percent to 17.5 percent in Q1 and Q2 2025, respectively, which is efficient capital retention.
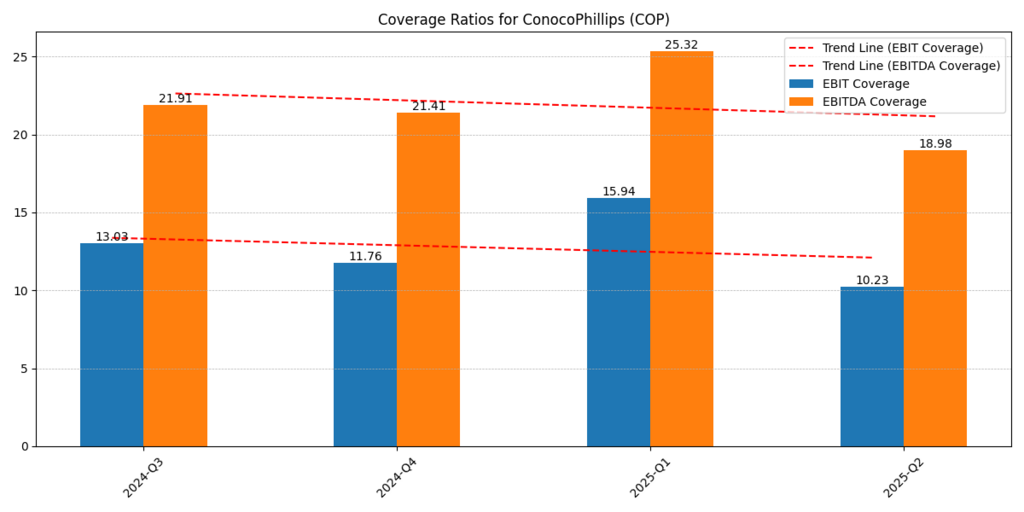
Figure 10: Dividends to Free Cash Flow (%) for APA Corporation (APA)
| Ratio | 2024 Q3 | 2025 Q2 | Trend |
| APA EBIT Coverage | –2.37 | 15.69 | Strong upward |
| APA EBITDA Coverage | 3.52 | 23.26 | Significant growth |
| APA Dividends/FCF | 22.6% | 17.5% | Decreasing payout ratio |
On the contrary, ConocoPhillips’ cash flow was neither dynamic nor stable. Even though APA is better positioned to recover its finances, COP has a conservative payout policy that will ensure a stable dividend to its shareholders in the long term (Zacks Investment Research, 2025).
Valuation Comparison: Bear, Base, and Bull Scenarios
A table below provides a summary of the low, medium, and high pricing of APA and ConocoPhillips (COP) in 2025:
| Company | Bear Case | Base Case | Bull Case |
| ConocoPhillips (COP) | $98 | $107 | $120 |
| APA Corporation (APA) | $32.8 | $34.9 | $37.4 |
COP is trading at a greater nominal price with a smaller range. Its smaller size means that APA does not pose as much of a losing threat as its size suggests, but it has a greater potential to gain. Both anchoring and loss aversion may influence the investor’s choice: risk-averse investors are anchored by COP’s reputation, and value-seekers are drawn to APA’s discounted price.
Apache vs. ConocoPhillips Analysis.
Where ConocoPhillips is best in the field in terms of financial discipline and scale, Apache is more efficient in its operations and valuation. It can be compared to a broader value-versus-quality trade-off that will characterize investor preferences in 2025.
Further Reading : ConocoPhillips Stock Forecast 2025: Can COP Outperform as Oil Prices Cool?
Further Reading : APA Stock Forecast 2025: Is Apache Undervalued or Overhyped?
Comparative Insights: APA vs. ConocoPhillips (COP)
Stability vs. Agility
APA vs. ConocoPhillips (COP): COP is more financially stable and has larger capital reserves, which is best for income- and low-volatility-oriented investors. APA is smaller yet more nimble, and it seems to attract individuals who value growth and recovery possibilities.
Profitability and Efficiency
COP is not large, but its margins are stable, suggesting its operations are mature and its risks are lower. APA’s gross and operating margins are high, indicating it is efficient in its operations but also vulnerable to changes in revenue. In terms of oil and gas profitability trends, APA cost recovery has provided appealing momentum, whereas COP margin control implies long-term sustainability.
Dividend Policy and Investor Appeal.
The analysis of dividend yield between APA and COP highlights two types of investors:
- Income Seekers: COP is more preferred in history and predictability.
- Growth-Oriented Investors: Bias towards APA due to its accelerating dividend and its increasing payout sustainability.
Valuation Psychology
Evaluating oil stocks 2025 at a lower price base, APA may also be able to attract more investors who will view it as an “undervalued oil stocks 2025.” COP, on the other hand, is more expensive and might discourage retail investors, but would attract institutions that are more concerned with stability and inclusion in the index.
Behavioral Finance Perspective: Human Psychology in Oil Stock Investing
The cognitive biases that are usually applied to investor decisions in APA vs. ConocoPhillips (COP) include:
- Anchoring Bias: Investors are obsessed with previous prices, e.g., COP is assumed to be priced at the fair value of 100.
- Herding Effect: Often, the flows of the retail investors reflect the institutional flows towards the large-cap companies such as COP.
- Recency Bias: APA recovered its lost ground in coverage ratios recently, a factor that can result in overvalued growth projections of APA by investors in the long term.
- Risk Perception Bias: COP is more comfortable due to the size and brand recognition, which is a psychological premium with no relation to real valuation measurements (Shefrin, 2020).
Understanding such biases would enable investors to balance reason and emotion when comparing APA vs. ConocoPhillips (COP) amid changing energy market growth scenarios.
Final Comparative Evaluation
| Aspect | Winner | Rationale |
| Operational Efficiency | ConocoPhillips (COP) | Higher Return on Assets (ROA) and stronger return on sales due to scale efficiency. |
| Financial Discipline | ConocoPhillips (COP) | Lower leverage and a more robust equity ratio reflecting prudent balance sheet management. |
| Valuation (Multiples) | APA Corporation (APA) | Trades at cheaper EV/EBITDA and P/E multiples, indicating relative undervaluation. |
| Cash Flow Scale | ConocoPhillips (COP) | Far superior Free Cash Flow to Firm (FCFF) and Free Cash Flow to Equity (FCFE) capacity. |
| Margin Quality | APA Corporation (APA) | Maintains higher gross and operating margins, driven by an efficient cost structure. |
| Risk-Adjusted Return | ConocoPhillips (COP) | More sustainable Return on Equity (ROE) supported by balanced leverage and lower volatility. |
Conclusion
Comparing APA vs. ConocoPhillips (COP), both APA stock forecast and price target have strong fundamentals, yet they serve different types of investors. ConocoPhillips (COP) remains a defensive investment, a steady, dividend-paying oil giant that appeals to income-seeking, risk-averse investors. Conversely, APA Corporation (APA) is a value-oriented upside play, suitable for investors willing to accept moderate risk and greater potential for capital growth.
According to the existing APA vs COP stock comparison 2025, the choice will be determined by risk tolerance and investment psychology. COP is stable and reliable in terms of returns, whereas APA is an undermarked oil stock with upside potential as the energy sector investment opportunities expand through 2025.
All calculations and valuation estimates are FinancialBeings’ own, based on data sourced from SEC filings and Yahoo Finance.
Frequently Asked Questions (FAQs)
What is the price target for APA and ConocoPhillips (COP) in 2025?
ConocoPhillips (COP) is available at a reasonable price, with reliable returns, at its base price of $107. The discount value offered by APA Corporation (APA) is reasonable, and the price is approximately $35 in the absence of volatility in oil prices; it is attractive to those investors who are not averse to volatility.
Which company shows stronger profitability — APA or ConocoPhillips (COP)?
ConocoPhillips is a profitable operator because it delivers higher returns on sales and ROA. Apache is also leaner, but it makes more use of leverage to increase returns.
Is APA stock undervalued compared with ConocoPhillips (COP)?
Yes, APA is trading at about half the EV/EBITDA ratio of ConocoPhillips (COP), which is an indication of undervaluation, but also increased operational risk.
Which oil stock offers better dividend stability?
ConocoPhillips is more sustainable in dividends due to its high free cash flow and low leverage.
What are the long-term growth prospects for APA and ConocoPhillips (COP)?
The size of ConocoPhillips guarantees reliable compounding, and APA offers a greater level of upside in cycles when oil prices are high.
Usama Ali
Usama Ali is the founder of Financial Beings and a self-taught investor who blends classic valuation study with insights from psychology. Inspired by works from Benjamin Graham, Aswath Damodaran, Stephen Penman, Daniel Kahneman, and Morgan Housel, he shares independent, data-driven research to help readers connect money, mind, and happiness.
Disclaimer
The content provided herein is for informational purposes only and should not be construed as financial, investment, or other professional advice. It does not constitute a recommendation or an offer to buy or sell any financial instruments. The company accepts no responsibility for any loss or damage incurred as a result of reliance on the information provided. We strongly encourage consulting with a qualified financial advisor before making any investment decisions.