Introduction
Examine the figures for AMD stock’s revenue, EBITDA, EPS, free cash flow, and margins. Explore more and find out an objective evaluation of AMD’s stock value for 2025.
Advanced Micro Devices (AMD) experienced outstanding achievement in 2024, which was an outstanding year in terms of expansion and strategic responses in the semiconductor sector. When compared to competitors, the company that specializes in AI, gaming, and high-performance computing is growing in prominence. The measures that defined AMD’s performance are examined in this year-end financial review, including revenues, EBITDA, EPS, FCF, and margins. A thorough explanation of AMD stock and its potential performance in 2025 is also provided along with an analysis of the elements that contributed to these figures. Moreover, the articles discusses the positive trends, which include revenue growth and margin expansion.
This company is making good use of the macroeconomic environment’s opportunities, including competition from other businesses. Tables and graphs show AMD’s statistics for the first three quarters of 2024 and TTM to give stakeholders and investors an overview of the company’s growth trajectory.
Key Takeaways
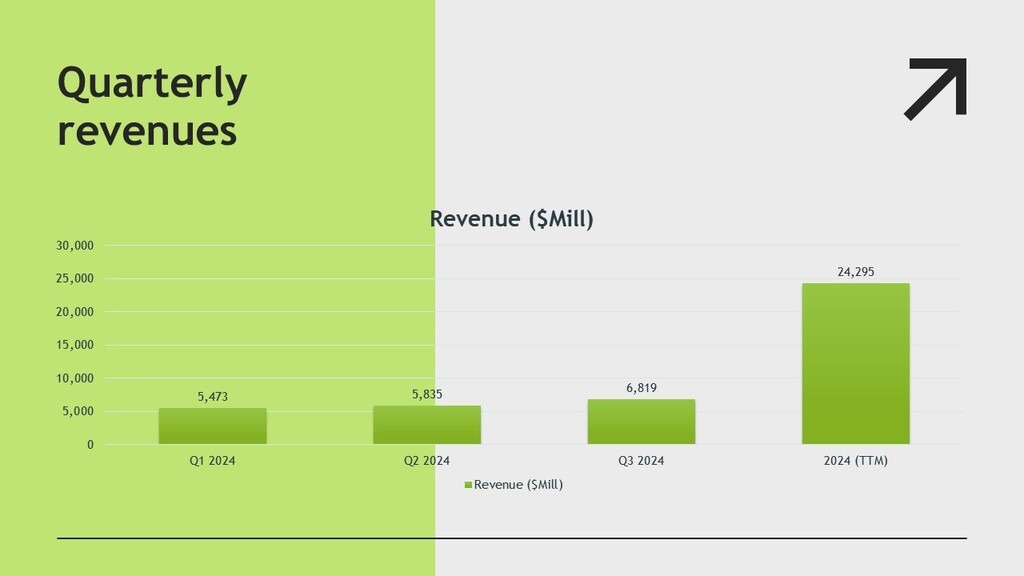
1. In 2024, AMD’s total revenue was $24.3 billion TTM. The company was able to achieve steady and sustained growth by utilizing customer adoption of new categories such as AI, gaming, and data centers.
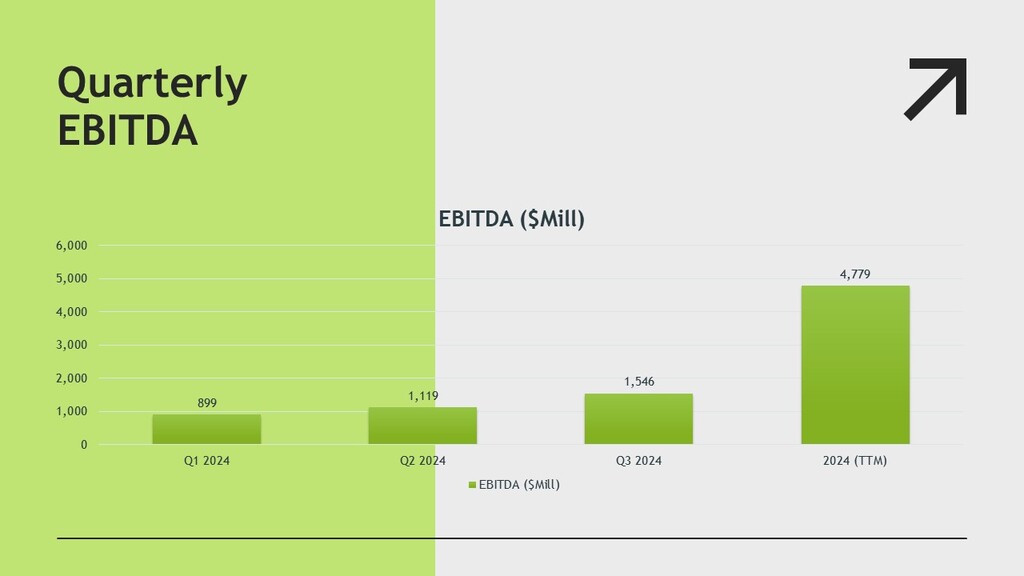
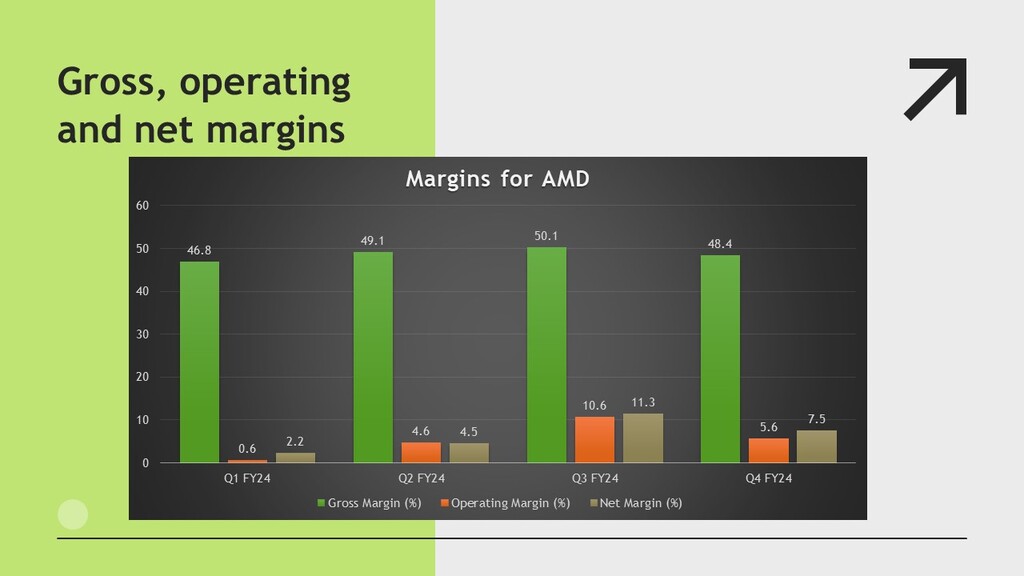
2. According to yields, EBITDA statistics increased by 72% between Q1 and Q3, and third-quarter margins increased to 11.3%. The company’s superb cost control and intentional focus on offering more value-added items are evident.
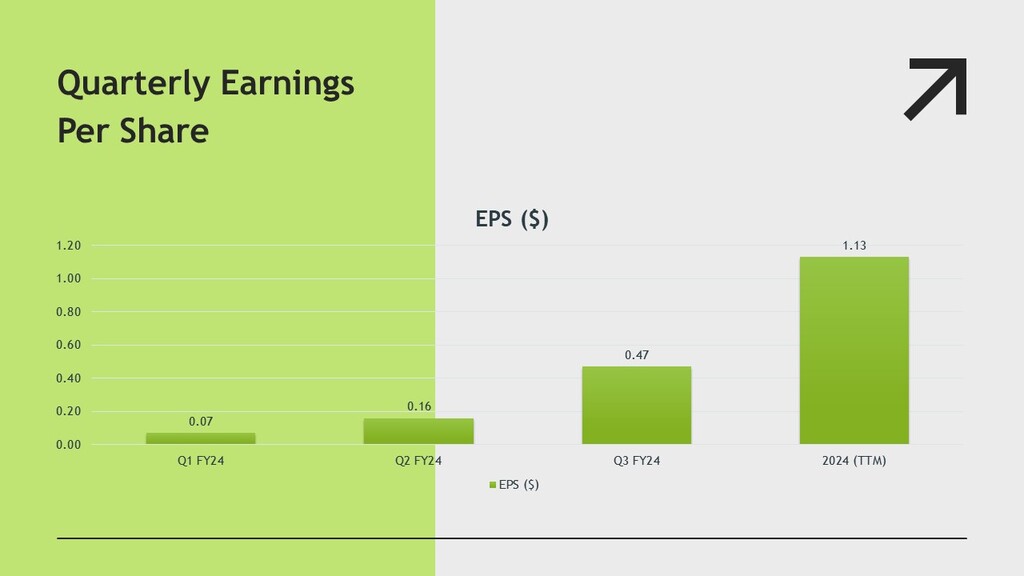
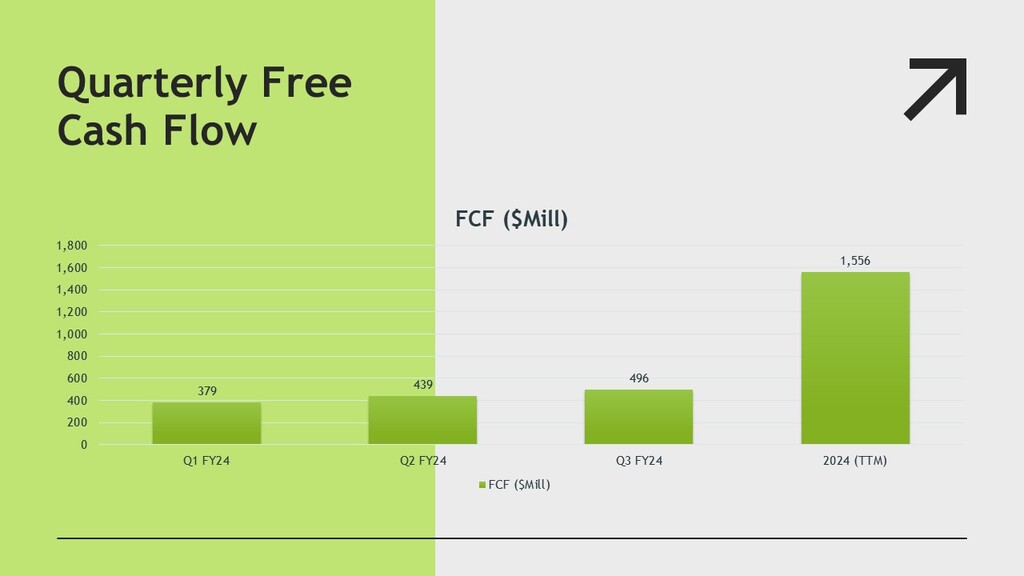
3. AMD’s EPS of $1.13 TTM showed that the company was doing better at creating value for its stockholders. Negative trends in free cash flow, however, point to significant investing in innovation, which will impact chances for future growth.
Financial Performance: Q1–Q3 2024 and TTM Metrics
| Metric | Q1 2024 | Q2 2024 | Q3 2024 | TTM FY2024 |
| Revenue ($000) | 5,473,000 | 5,835,000 | 6,819,000 | 24,295,000 |
| EBITDA ($000) | 899,000 | 1,119,000 | 1,546,000 | 4,779,000 |
| EPS ($) | 0.07 | 0.16 | 0.47 | 1.13 |
| FCF ($000) | 3,220,000 | 3,115,000 | 1,121,000 | 1,556,000 |
| Margins (%) | 2.24 | 4.5 | 11.3 | 7.5 |
AMD Revenue Analysis
The company’s most recent revenue of $25.36 billion in 2024 demonstrates that it is well-positioned in the competitive market and that there is a need for the newest processors generation and graphics card. Revenue was $5.47 billion in Q1 and $6.82 billion in Q3, an 11% increase over the previous quarter. Revenue was $24.3 billion, according to the TTM, which demonstrates the company’s broad range of products and emphasis on profitable market niches like gaming and artificial intelligence. Here is our list of next gen technology companies, Best 5 Quantum Computing Stocks for 2025.
This growth is in line with AMD’s increased emphasis on custom silicon and data centers, two sectors on which it has become increasingly dependent in recent years. However, there were other risks, such as the possibility that AMD might face the same issues as Intel, pressures on prices, and competition. AMD is the most suited player in the semiconductor sector because of its ability to respond to market conditions and use them to create business opportunities, evidenced by its consistent quarter-over-quarter growth. [1]
AMD EBITDA Analysis
AMD achieved amazing cost control and operating efficiency in 2024, when its EBITDA skyrocketed. EBITDA jumped 72% over the first three quarters, from $899 million in the first quarter to $1.55 billion in the third. According to the TTM, the amount $4.78 billion reflects well for AMD’s ability to turn a profit, particularly in an inflationary environment with rising R&D overhead. Increased sales and a higher gross margin due to the constituent product mix are consistent with this improved EBITDA.
The company’s emphasis on high-end product lines, including as its EPYC CPUs for servers, helped optimize the average selling price, which in turn helped boost EBITDA gains. However, supply chain issues and cost increases linked to new items partially lowered these profits. All things considered, AMD’s effectiveness in overseeing expansion projects and maintaining discipline in cost control is clearly shown by the EBITDA trends. The company was well-positioned to reinvest in innovative technology that would provide long-term total value for its investors. [1]
AMD EPS Analysis
Based on the position of shareholders, earnings per share (EPS) provides a picture of the company’s profitability. According to the EPS, AMD Company grew pretty quickly in 2024, starting at $0.07 in Q1 and reaching $0.47 in Q3. The company’s TTM EPS of $1.13 indicates a strong recovery from some of the challenges it faced in previous fiscal years. Despite more R&D spending as AMD aims to surpass its competitors, the EPS growth is the result of higher revenues and effective cost control. Sales growth, especially in high-margin areas, and improved operating efficiency during the third quarter are the main causes of the operating margin gain.
The modest results from previous quarters, however, suggest that AMD is still having trouble with pricing in its consumer portfolios. Investors are optimistic about AMD’s capacity to deliver a consistent return on investment based on its EPS trend, particularly if the firm capitalizes on expansion in the data center, gaming, and artificial intelligence sectors.
AMD Free Cash Flow (FCF) Analysis
AMD’s Free Cash Flow (FCF) for 2024 indicates that there is a complex financial environment. The current year’s FCF stood at 3,220 million in Q1 and fell to 1,120 million in Q3, putting the TTM FCF down to 1,560 million. A decline in free cash flow, especially during the second half of the year, suggests that more capital expenditure will be needed for products of the future.
Nonetheless, AMD’s positive free cash flow (FCF) indicates that business can generate cash even during periods of high capital expenditure. Strong cash conversion cycles in the first quarters demonstrate high FCF, which supports the company’s R&D and market expansion efforts. Although the recent decline in figures is a matter that warrants monitoring, they are not particularly concerning; rather, they suggest AMD’s aggressive growth strategy. As AMD gains its share of high-growth sectors, this reinvestment in innovation may translate into stronger profits for long-term investors. [2]
AMD Gross, Net and Operating Margins
AMD’s profit margins have significantly increased in 2024. Between Q1 and Q3 of 2024, margins increased from 2.24% to 11.3%, with a TTM average of 7.5%. The segment’s growing percentage shows that attempts are being made to provide more value-added goods, such as data center and AI processors.
Under pressure from other chip companies like NVIDIA and Intel, the margin expansion also shows improved control over operating expenses and the capacity to raise pricing. The substantial increase in the Q3 margin shows that AMD’s high-end products are profitable and that the supply chain has changed. However, AMD has struggled to control expenses and pursue growth, particularly in the low-margin consumer segment, as evidenced by the reduced margins observed in the first half. Maintaining and increasing these margins will be essential to businesses’ future success and expansion. [2]
Conclusion
AMD’s 2024 performance demonstrates its significant competitiveness to Intel, with increased revenue and profitability despite market challenges. The company’s strategic move to penetrate high-margin business segments, particularly data centers and AI-related products, has led to increased EBITDA, EPS, and margin numbers. However, free cash flows reached a low in the second half of the year, indicating investment in innovation. As AMD expands its market base in emerging markets and expands its product offerings, it is well-positioned to create sustainable value for shareholders. The company’s focus on technological advancements, operational productivity, and market responsiveness makes it a unique asset for investors in the technology sector for 2025 and beyond.
**Please be informed that the content is informational and by no means serve as a buy or sell signal. The company is not responsible for the loss of capital.