Overview
Tesla Stock Volatility Following Q3 Earnings: Analyze Investors to Buy in 2025 or be Cautious, as Market Volatility Challenges Their Resolve. Discover how earnings, innovation, EV market growth, and Tesla valuation demand can impact the long-term stock trend of Tesla. Tesla Inc. (TSLA) has consistently appealed to investors as a symbol of the electric car revolution, which is also a broader technological revolution encompassing automation, robotics, and artificial intelligence (AI). Nonetheless, its recent 2025 Q3 earnings have made Tesla’s stock volatility again: is it still trading on the perception of future growth, or is Tesla under pressure to bring its margins and multiples of its valuations nearer to normal?
The current financial figures present conflicting results. The value of optimism conflicts with profits due to market psychology, which is not compatible with traditional views of the car sector because of the anticipation of robotaxis and AI-driven revenues.
Tesla’s Post-Earnings Volatility and Market Psychology
The reaction to Q3 2025 earnings emphasizes the discrepancy between sentiment and fundamentals. Tesla share price volatility spiked due to the poor performance in revenue growth by the company. The daily price movements were a reaction to shrinking profit margins and new delivery instructions, and were executed through algorithmic trading.
Such action proves the ambivalent mentality of the Tesla investor sentiment trend. The long-term holders view the company as a technical platform that is scalable in terms of AI. Conversely, short-term speculators believe that the earnings stabilization was a sign that the premium story could be overstated. Behavioral finance theory suggests that overconfidence and anchoring bias have a positive effect on the increase in volatility when the expectations are recalculated (Tversky and Kahneman, 2021).
Tesla Q3 2025 earning analysis provided, shows a continuous growth in revenue but decreased margins, indicating that the company is currently moving into an operational maturity level after hypergrowth. This provoked the increased volatility on the tesla stock as investors reevaluated the balance between the potential of innovations and short-term profitability.
Operating Efficiency Decomposition (2017–2025)
The company’s transition from losses to consistent profitability and then to progressive normalization is depicted in Tesla’s operational data, which is obtained from internal efficiency decomposition (see Figure 1).
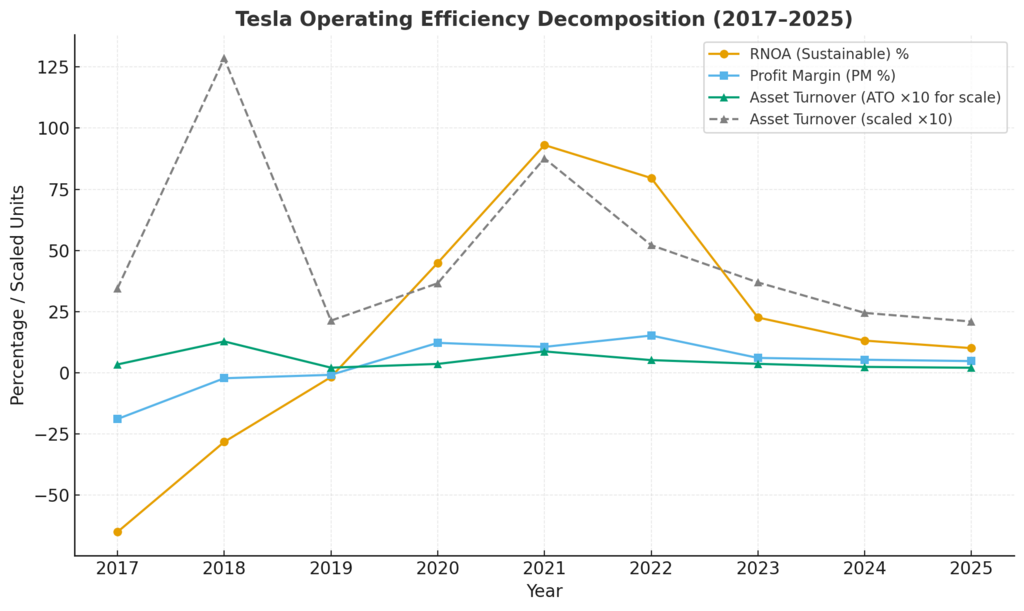
Figure 1: Tesla Operating Efficiency Decomposition (2017–2025)
Due to its low scale and significant capital expenditures, Tesla’s Return on Net Operating Assets (RNOA) was negative during the initial years (2017–2019). Cost control and increased output per facility were the primary drivers of the 2020 profitability inflection, which resulted in RNOA soaring to 44.9%. The RNOA of the company was in line with supernormal returns, with a high of 93.1% in 2021. Nevertheless, in 2022, this urge decreased, indicating that the efficiency of production and the power of prices have reached their peak.
It also breaks down the profit margin (PM) and asset turnover (ATO) using the graph. In 2024, Tesla had an ATO of about 2.8 times, and its profit margin, nevertheless, did not change but stayed at 5-6%. These tendencies suggest that Tesla remains a business, but its smaller achievements are no longer as apparent. The correlation between RNOA and PM suggests decreasing marginal returns to operating assets, which is an important consideration in long-term valuation models.
Net Operating Assets and Leverage Dynamics
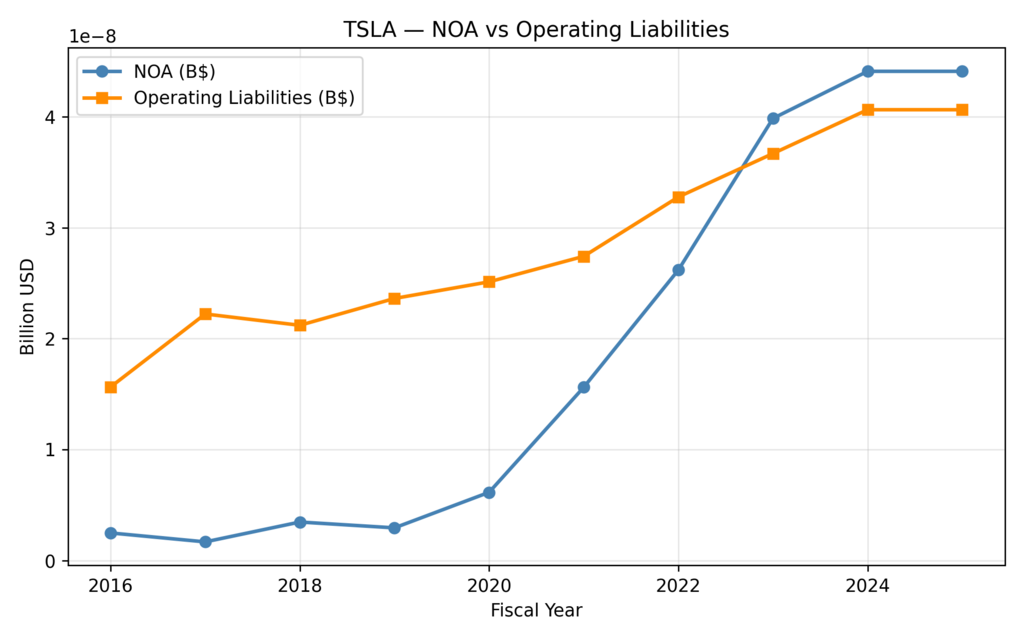
Figure 2: TSLA — NOA vs Operating Liabilities (2016–2025)
The net operational assets (NOA) of Tesla increased significantly since 2020 and indicate an aggressive approach toward vertical integration and reinvestment in gigafactories. But operating liabilities increased during the same period with the form of creditors of suppliers and delayed sales. Since the identical volume of output currently takes a greater number of assets, the relative change shows that capital efficiency at Tesla has leveled.
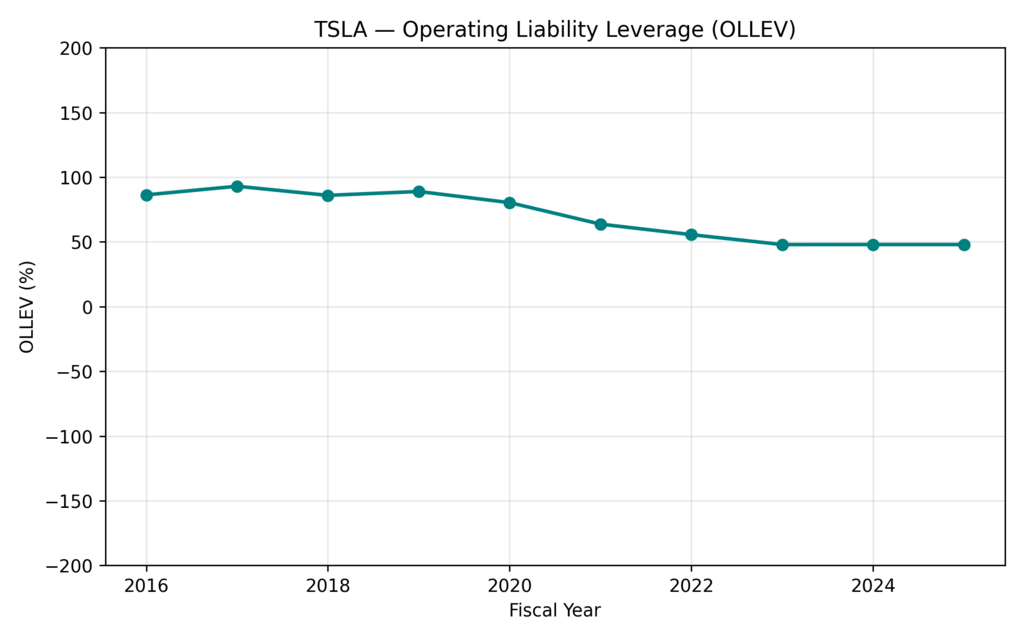
Figure 3: TSLA — Operating Liability Leverage (OLLEV) 2016–2025
The Operating Liability Leverage (OLLEV%) was kept at 45-95 percent throughout the period of the study. The fact that Tesla started to fall after 2021 is an advanced sign that the company is not as dependent on the trade finance as domestic cash flows. A low financial elasticity prevents short-term amplification of ROE although lower debt enhances solvency.
Profitability and Efficiency: Tesla vs GM Comparison
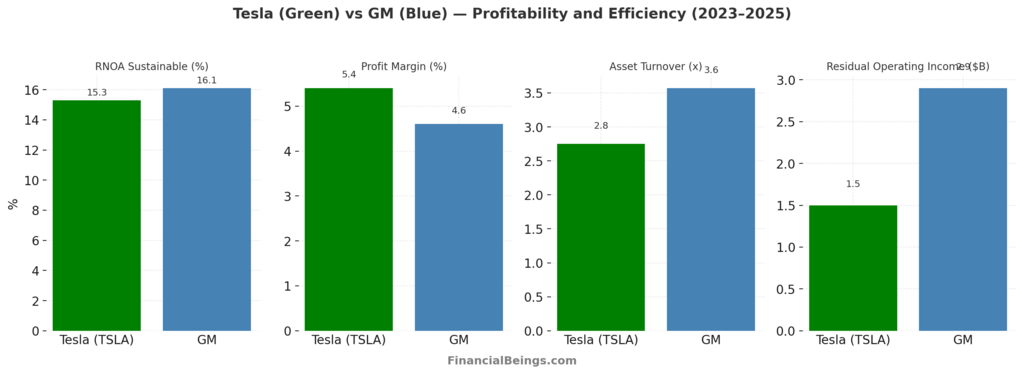
Figure 4: Tesla (Green) vs GM (Blue) -Profitability and Efficiency (2023–2025)
| Metric | Tesla (TSLA) | GM |
| RNOA Sustainable (%) | 15.3 | 16.1 |
| Profit Margin (%) | 5.4 | 4.6 |
| Asset Turnover | 2.8 | 3.6 |
| Residual Operating Income ($ B) | 1.5 | 2.9 |
However, even with the technological innovations at its disposal, a comparison between the two companies reveals that the most important indicators of operating efficiency in Tesla are not below but equal to those of the General Motors. GM is better off in asset turnover and residual operating income than Tesla although Tesla commands a slightly higher profit margin.
This comparison makes the multiple doubtable in Tesla at present. The fact that the business units of AI, robots, and robotaxis are at their infancy are reflected in the stock price. Tesla as an auto manufacturing company has a business model closer to that of an established industrial manufacturer rather than a technological company on the rise. The fact that price behavior is more closely linked to speculative mood than to comparative financial performance highlights the reason why Tesla stock volatility is likely to continue (Morgan Stanley Research, 2024).
Sustainable Profitability Trend (RNOA Sustainable)
| Year | RNOA Sustainable (%) | Direction | Comment |
| 2020 | 44.9 | Surge | Profitability inflection point |
| 2021 | 93.1 | Peak | Supernormal returns post-scale |
| 2022 | 79.6 | High | Still strong, driven by pricing |
| 2023 | 22.6 | Decline | Margin compression begins |
| 2024 | 13.2 | Fading | Normalization phase |
| 2025 | 10.1 | Stabilizing | Near the cost of capital |
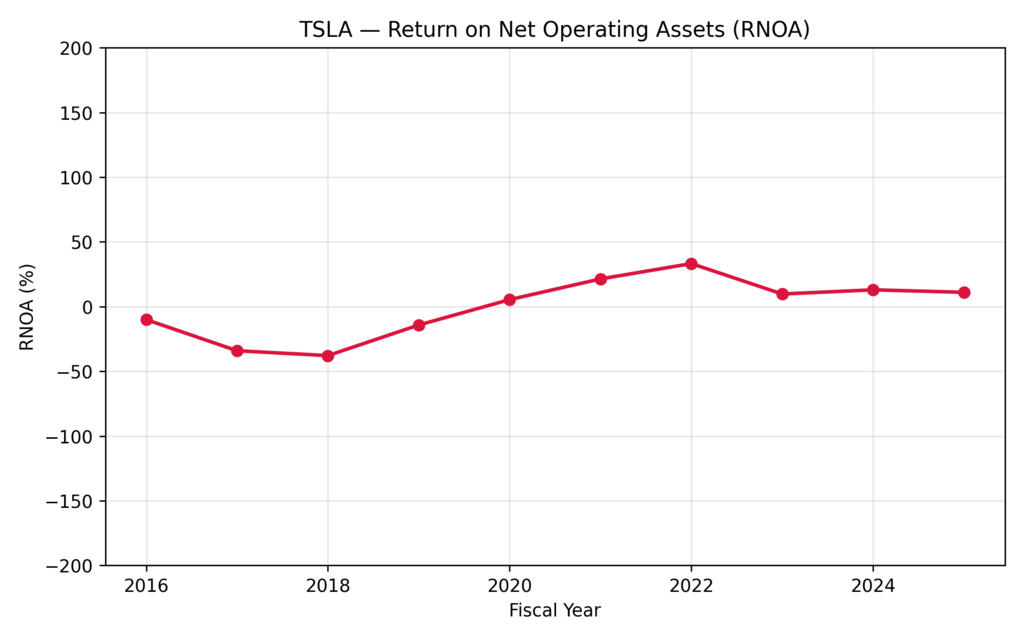
Figure 5: TSLA — Return on Net Operating Assets (RNOA), 2016–2025
Tesla’s transition from hyper-growth to normalcy is summarized in the table above. By 2025, RNOA Sustainable had dropped to 10.1% from its peak of 93.1% in 2021. This pattern suggests that the once exceptional returns are approaching industry standards as the company enters a mature stage of cost-of-capital equilibrium.
Residual Earnings and Value Retention
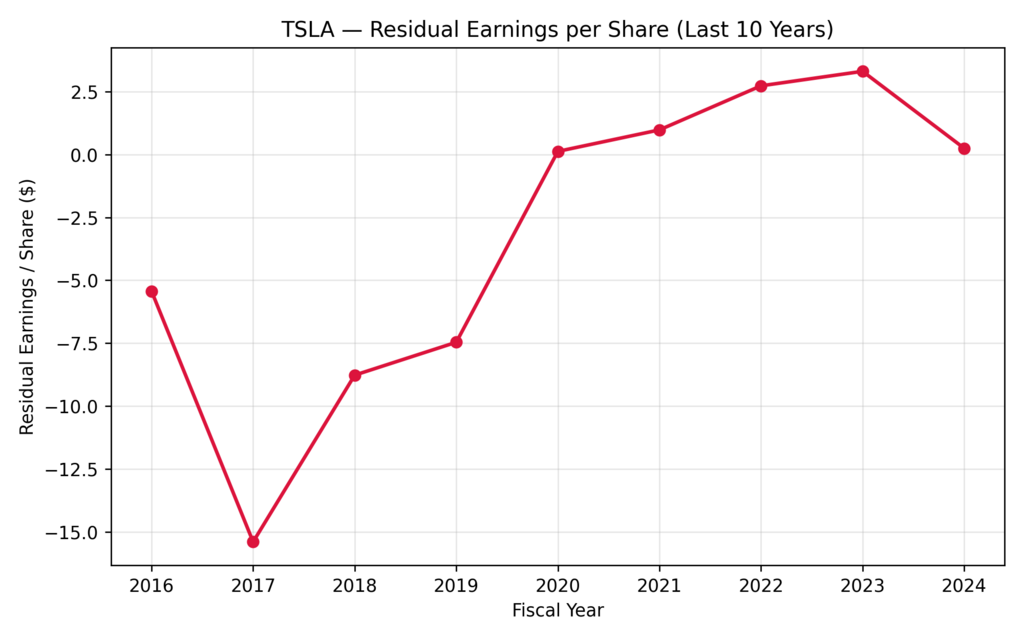
Figure 6: TSLA – Residual Earnings per Share (Last 10 Years)
Tesla’s transition from severe losses to moderate profitability between 2016 and 2023 is demonstrated by residual earnings per share, or REPS. The fact that operational growth is no longer proportionately transferring into shareholder value is shown by the peak in 2023 and the little decrease in 2024. According to valuation theory, price volatility increases when REPS reaches a plateau while expectations stay high because investors find it difficult to reconcile growth narratives with accounting results.
Further Reading : Tesla Stock Forecast 2030: Can TSLA Reach New Heights with EVs, AI & Energy Growth?
Should I buy Tesla stock after earnings
Tesla’s innovation pipeline continues to determine its future course. However, it is now necessary to consider risk-adjusted expectations when evaluating the long-term Tesla stock forecast 2025. The notion that robotics or driverless cars will immediately increase profits has not come to pass. Therefore, rather than drastic new revenue streams, the future of Tesla stock performance will be reliant on little efficiency improvements in the future. Should you consider buying TSLA stock after it is shifting towards AI and how would it compete with Nvidia in AI space in 2026? Answers are in our latest study.
The mood of investors remains erratic, fluctuating between optimism and exhaustion. Sharp rallies are frequently followed by equally steep corrections, which are familiar with high-expectation stocks. The claim that Tesla stock volatility is a normal aspect of the brand’s market psychology rather than an outlier is supported by this cyclical tendency (Bloomberg Intelligence, 2025).
Strategic Implications for Investors
Tesla is now a low-dividend and high-beta stock that is primarily fueled by narrative momentum. Pullbacks are viewed as short-term opportunities by speculative traders, but to risk-averse investors, they are considered a warning of what is currently happening in the normalization process. An intelligent Tesla stock dip buying strategy founded on a real occasion, like actual AI monetization or expansion in ROIC, instead of passion alone. In general, despite Tesla’s continued leadership in innovation, the value gravity and profitability cycles cannot be ignored; hence, it is not the time to celebrate in 2025.
Conclusion
The volatility of Tesla after the third quarter in 2025 is an indication that the company is shifting its growth pattern towards a more normalized growth path, as opposed to the rapid rate of growth. Financial ratios, including RNOA, profitability, and remaining earnings, indicate a stable but declining performance, in spite of the comparisons with GM indicating that the large part of Tesla value premium remains based on unknown potential in the future. Simply stated, Tesla stock volatility amounts to the conflict between the story and the underlying. Tesla is nearly reaching its cost of capital; active purchasing does not seem to be the right choice; it is better to be cautiously optimistic about it based on factual information.
Despite a strong innovation record, the Elon Musk market outlook often extends beyond Tesla’s current fundamentals, sustaining valuation premiums but also magnifying volatility during market corrections.
Does Tesla usually go up or down after earnings?
The stock of Tesla has a historical above-average volatility of post-earnings. Often the management tone, delivery outlook, and forward projection have an influence on the response that is greater than the actual numbers. Consequently, both major rallies and corrections are common occurrences.
Is Tesla a highly volatile stock?
Indeed. Tesla stock is also likely to magnify the movement of the markets since its beta is far greater than the average of S&P 500. Furthermore, all algorithmic trading, retail trading, and speculative positioning that surrounds the theme of AI, robotaxis, etc affect volatility (Bloomberg Intelligence, 2025).
Are Tesla profits falling?
Tesla profits are not declining, but are level. Margins have become narrow as a result of increased cost of production and competition in terms of pricing. The structural return to the long-run, though reduced, profitability showed itself in the RNOA of the company, which dropped to 93% in 2021 and then to around 10% in 2025.
Usama Ali
Usama Ali is the founder of Financial Beings and a self-taught investor who blends classic valuation study with insights from psychology. Inspired by works from Benjamin Graham, Aswath Damodaran, Stephen Penman, Daniel Kahneman, and Morgan Housel, he shares independent, data-driven research to help readers connect money, mind, and happiness.
Disclaimer
The content provided herein is for informational purposes only and should not be construed as financial, investment, or other professional advice. It does not constitute a recommendation or an offer to buy or sell any financial instruments. The company accepts no responsibility for any loss or damage incurred as a result of reliance on the information provided. We strongly encourage consulting with a qualified financial advisor before making any investment decisions.
