
Introduction
Determine whether Apache Corporation (APA) is overpriced or undervalued with our APA Stock Forecast 2025. Examine analysts’ most current price estimates, dividend outlook, and growth prospects to decide whether to buy, sell, or hold APA in 2025. Due to its fluctuating financial and operational performance, Apache Corporation (APA) remains one of the energy stocks seeking attention. The company’s financial picture has changed dramatically over the past few quarters, showing better internal controls, more profitable operations, and better debt coverage. Operating margins, free cash flow, and dividend payments are important metrics that demonstrate that APA has maintained its financial stability despite shifting commodity prices and industry challenges.
However, a gap in perception persists; some observers see the revival of the company as a basis to create long-term value, whereas others are worried about market volatility and the cyclical nature of the Apache oil and gas performance. It leads to one central question: Does the Apache energy stock forecast actually mean that the firm is underestimated, or is hope being greater than the financial potential of the firm?
The given analysis will provide answers to this question by analysing the internal financial performance of APA, such as revenue trends, trends in margins, history of dividends, and capital structure. It also compares intrinsic value situations based on the reported data of APA buy or sell analysis to explain whether existing figures indicate the persistence of a favourable recovery perspective into 2025.
Financial Overview: Transition Toward Stability
Revenue, EBITDA, and Free Cash Flow
Performance in recent quarters has been inconsistent. Revenue decreased to $2.18 billion in 2025 Q2 after increasing from $2.53 billion in 2024 Q3 to $2.71 billion in Q4 (see Figure 1). EBITDA increased from $356 million in 2024 Q3 to $1.63 billion in 2025 Q2, indicating cost optimisation and efficiency gains, despite the decline in revenue.
Both operational susceptibility to commodity cycles and higher cash conversion in subsequent quarters were demonstrated by the dramatic fluctuations in free cash flow (FCF), which dropped from $408 million to $306 million before rising to $514 million (APA Corporation, 2025).
For long-term investors following the APA stock prediction for 2025, these results indicate that internal capital discipline has improved despite continuous cyclical volatility.
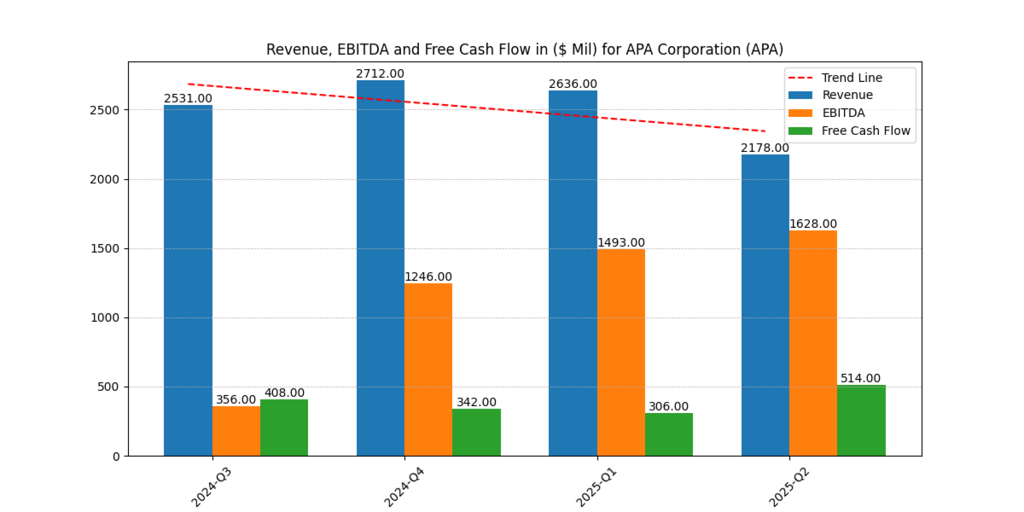
Figure 1: Revenue, EBITDA, and FCF for APA 2024–2025)
Margins and Efficiency: Recovering Profitability
APA’s profitability ratios have improved noticeably. While the gross margin dropped from 43.6% in 2024 Q3 to 40.0% in 2025 Q2, the operating margin fell from 34.6% to 30.8%. However, the net margin, which turned losses into significant net gains, showed the most notable improvement, rising from -8.8% to 27.7% (APA Corporation, 2025).
This reversal shows that cost-cutting and operational reorganisation have outpaced a little decline in revenue. Realising the gain predicted by the APA stock forecast 2025 models will depend on maintaining these margins.
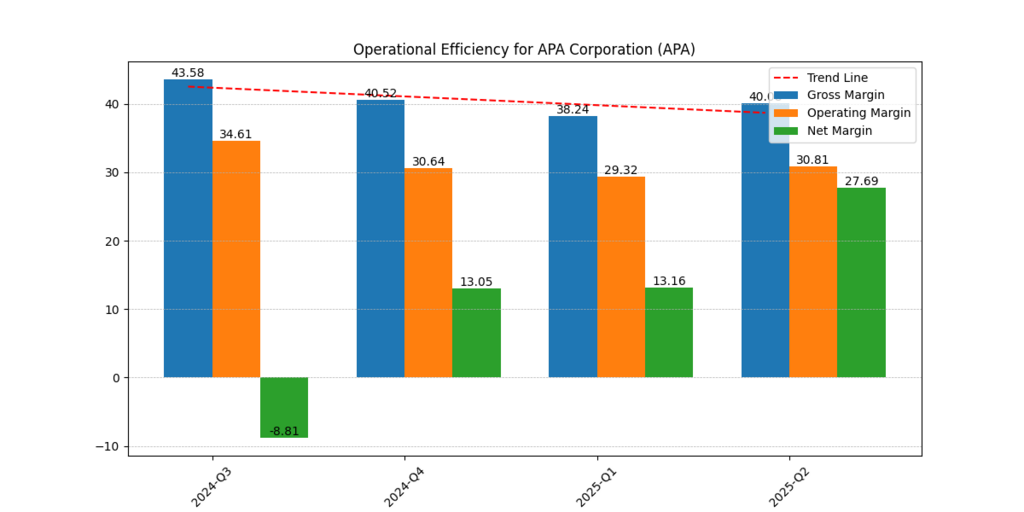
Figure 2: Operational Efficiency 2024–2025)
Leverage, Liquidity, and Coverage
Strengthening Balance Sheet
Between 2024 Q3 and 2025 Q2, APA’s total assets-to-liabilities ratio increased from 1.47 × to 1.62 ×, and its net tangible assets-to-liabilities ratio improved from 0.39 × to 0.53 × (Figure 3). Increased solvency and lower leverage risk are shown by these upward movements (APA Corporation, 2025).
Coverage Ratios
The ability to service debt has significantly improved. EBITDA coverage jumped from 3.52 × to 23.26 ×, while EBIT coverage grew from –2.37 × (2024 Q3) to 15.69 × (2025 Q2) (Figure 4). This increase in coverage points to a robust earnings recovery and a decreasing interest burden, two important factors that bolster trust in APA stock valuation 2025.
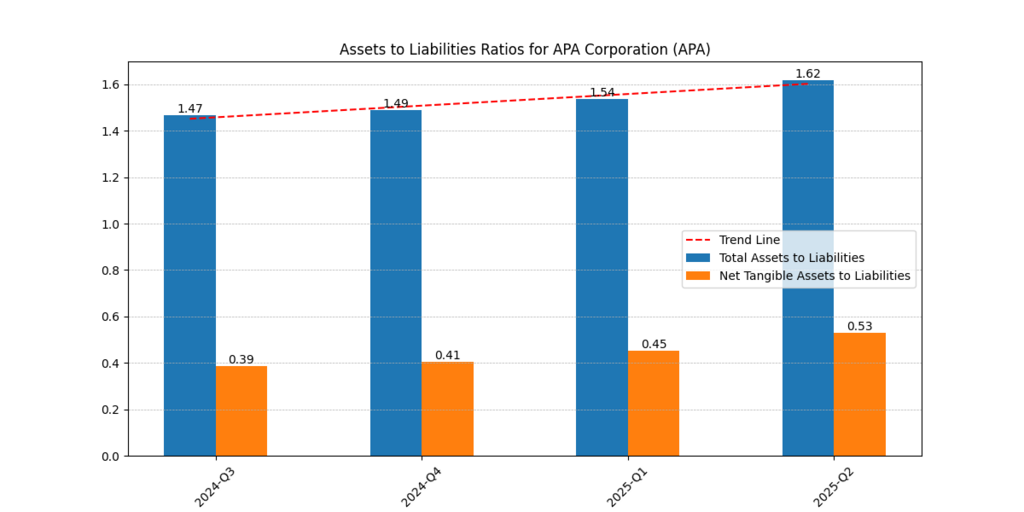
Figure 3. Assets-to-Liabilities Ratios for APA Corporation (Q3 2024 – Q2 2025).
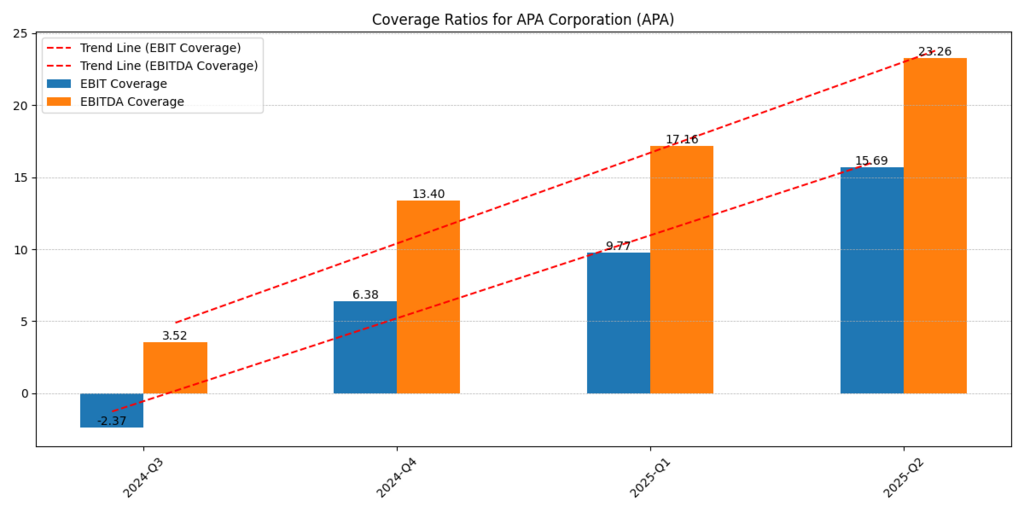
Figure 4. Coverage Ratios for APA Corporation (Q3 2024 – Q2 2025).
Dividend Performance and Sustainability
Dividends and Yields
APA has consistently paid out dividends to stockholders. With only a slight decline to $0.97 in 2024, dividends per share increased from $0.15 in 2021 to $1.01 in 2023 (APA Corporation, 2025). The dividend yield showed significant income growth, rising from 0.68% to 4.36%.
Alignment of payout and free cash flow
A trailing-twelve-month average of 24.25% was reached by the dividends-to-FCF ratio, which ranged from 22.6% to 29.7% (Figure 6). This small payout enhances APA’s reputation as an equitable dividend payer in the energy sector by promoting reinvestment while maintaining strong returns.
This consistency supports the assertion that the APA stock forecast 2025 is still constructive rather than speculative.
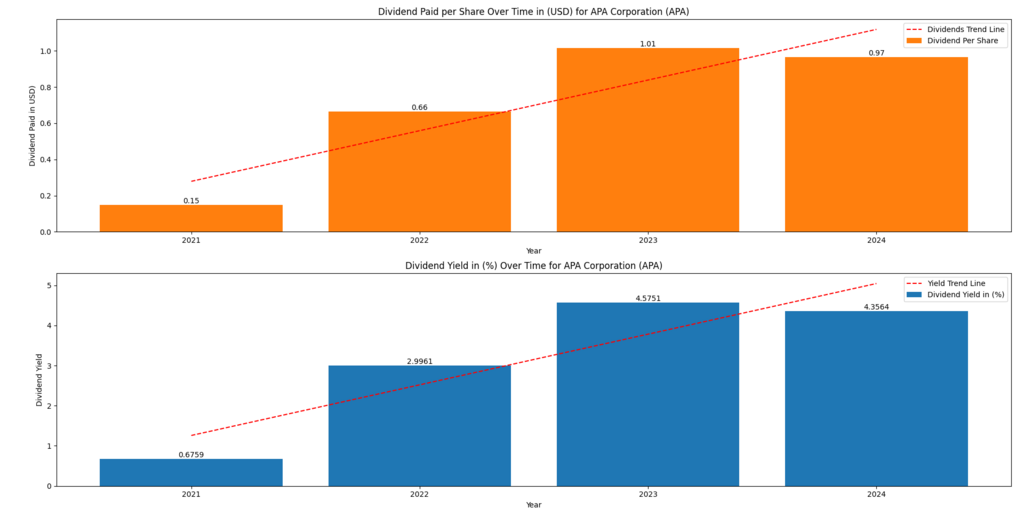
Figure 5. Dividend Trends for APA Corporation (2021 – 2024).
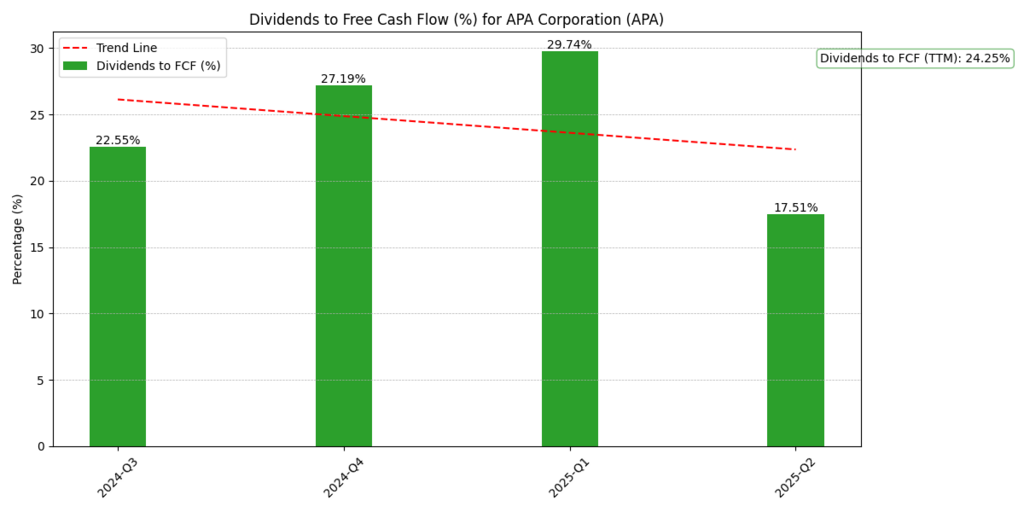
Figure 6. Dividends-to-Free-Cash-Flow (FCF) Ratios for APA Corporation (Q3 2024 – Q2 2025).
Analyst Consensus Range
With a high estimate of $35 and a low estimate of $16, 28 analysts who follow APA Corp. for 2025 have a median aim of $23 per share (APA Corporation, 2025).
| Analyst Forecast Range | Price (USD per share) |
| High Estimate | 35.0 |
| Median Target | 23.0 |
| Low Estimate | 16.0 |
Although there is an extensive range in these figures, the median estimate is still below intrinsic valuations derived from internal modelling, which raises the possibility of market conservatism.
Intrinsic Valuation Scenarios 2025
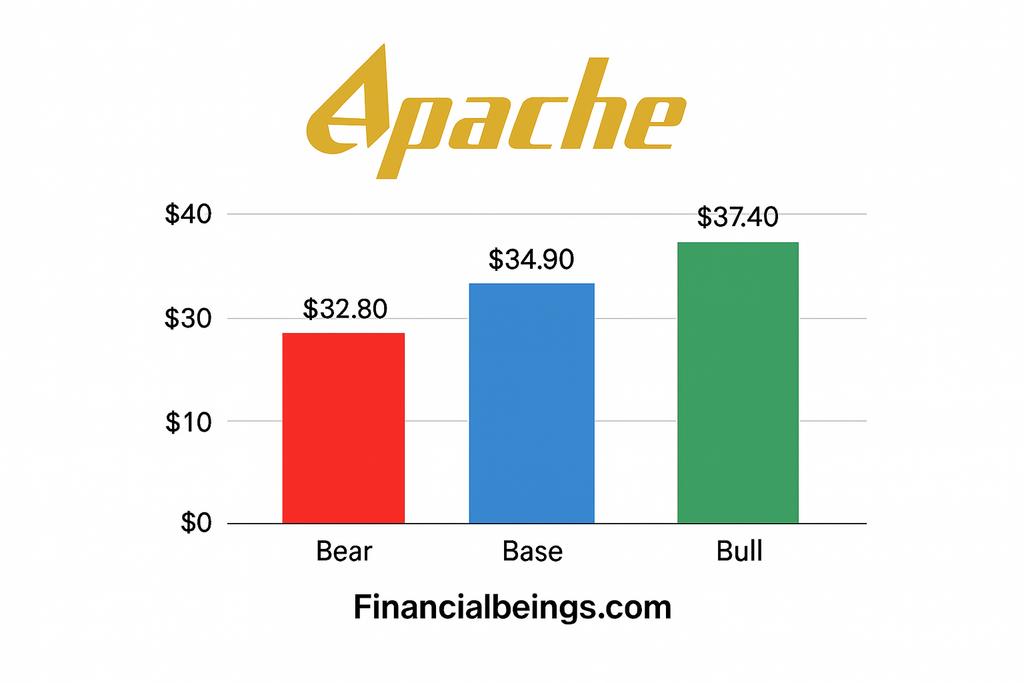
| Scenario | Intrinsic Value (USD) | Assumptions |
| Low Case | 32.8 | Commodity softness and margin compression |
| Medium Case | 34.9 | Stable oil pricing and continued leverage reduction |
| High Case | 37.4 | Commodity rebound and margin expansion |
When compared to the expert median of $23, even the bear scenario suggests undervaluation. This gap offers an opportunity to investors who think APA’s cost reductions and enhanced cash creation are sustainable in the Apache stock long-term prospect.
Further Reading : OXY vs XOM Dividend Comparison 2025: Price Targets & Undervaluation!
Behavioural and Psychological Dynamics
The prognosis for Apache Corporation’s share price outlook is rarely determined only by financial performance; rather, investor sentiment usually dominates short-term fluctuations.
- Anchoring bias: Due to their continued association with APA’s worse 2023 performance, many investors undervalue the most recent improvement.
- Cautionary optimism: A better net margin and higher coverage ratios might eventually dispel that uncertainty.
- Fear of missing out (FOMO): If oil prices climb, momentum traders may boost their winnings above their inherent value. It is necessary to comprehend these biases in order to interpret APA stock forecast 2025 narratives. Perception, not just math, may determine valuation swings.
Strategic and Operational Insights
Operational Efficiency
Better productivity and more effective project management lead to quarterly increases in EBITDA. Management of Balance Sheets
APA’s deleveraging activities are producing measurable balance-sheet resilience, as seen by increased assets-to-liabilities ratios (1.62 x).
The Dividend Discipline
By maintaining flexibility in capital deployment through a 24% distribution of free cash flow, APA is able to finance exploration or debt reduction without sacrificing shareholder returns.
Together, these deliberate moves lend credence to the APA stock prediction 2025 paradigm, which emphasises steady, incremental growth over rapid increase.
Risk Profile
Despite the economy’s improvement, a number of challenges remain:
- Commodity Volatility: Shifts in the price of oil and gas continue to be the primary factor affecting revenue stability.
- Interest-Rate Exposure: Growing borrowing rates could pose a challenge to free cash flow margins.
- Capital Expenditure Demands: Both exploration and maintenance require constant investment levels.
- Market sentiment: If investors continue to undervalue smaller upstream businesses, there could not be many chances for multiple expansion.
How these risks are addressed will determine whether APA achieves its base-case intrinsic valuation of $34.9 by 2025.
Comparative Positioning within Energy Sector
In contrast to its mid-cap energy peers, APA’s growing EBITDA coverage (23.26 times) and consistent dividends show a balanced risk-return posture. The increase in its asset-to-liability ratio from 1.47 to 1.62 enhances financial stability while maintaining leverage efficiency for long-term investors looking for dependable exposure to U.S. hydrocarbons (APA Corporation, 2025).
Conclusion
APA Corporation’s 2025 storyline focuses on bolstering the balance sheet and operational recovery. Better asset leverage, consistent dividends, disciplined free-cash-flow allocation, and rising coverage ratios are all indicators of a company that is regaining financial equilibrium.
According to the APA stock forecast 2025, the bear’s intrinsic value of $32.8 offers a substantial premium over consensus forecasts, suggesting that it is more likely to be undervalued than overhyped.
For investors who value dividend stability and long-term fundamentals, APA is a decent medium-risk energy investment. It is set up to realise value steadily through 2025 and beyond.
Is APA a good stock to buy?
APA’s operating returns (RNOA) remain comfortably above its required return for equity. The market’s implied negative growth expectation reflects excessive pessimism, assuming a decline in earnings power inconsistent with APA’s underlying fundamentals. The model shows that APA’s fair value lies between $32.8 and $37.4 per share, highlighting meaningful undervaluation and operational strength.
Is APA undervalued?
According to our internal valuation model, which adjusts earnings for the cost of capital rather than relying on conventional net income, APA appears to be priced under conditions of excessive market pessimism. This sentiment is not fully justified given the company’s strong Return on Net Operating Assets (RNOA) and its ability to sustain profitability even as the broader oil market faces headwinds. In essence, the market is discounting APA’s operational efficiency far more harshly than its fundamentals warrant.
How often is APA dividend?
APA pays dividend quarterly. The dividend yield in 2024 was around 4.4%. However, the current quarter dividends are 17.51% of the total free cash flow.
Usama Ali
Usama Ali is the founder of Financial Beings and a self-taught investor who blends classic valuation study with insights from psychology. Inspired by works from Benjamin Graham, Aswath Damodaran, Stephen Penman, Daniel Kahneman, and Morgan Housel, he shares independent, data-driven research to help readers connect money, mind, and happiness.
Disclaimer
The content provided herein is for informational purposes only and should not be construed as financial, investment, or other professional advice. It does not constitute a recommendation or an offer to buy or sell any financial instruments. The company accepts no responsibility for any loss or damage incurred as a result of reliance on the information provided. We strongly encourage consulting with a qualified financial advisor before making any investment decisions.
