What is the UNH Stock Forecast 2025? An overview of operational efficiency, cash flow, and debt over the recent history of the company will reveal valuable insights about the company, its financial stability, and the direction it may take in the future. UnitedHealth Group Incorporated (UNH) is one of those companies that still attracts the attention of investors, as it is a large player in the healthcare and insurance industry. As demand in healthcare upsurges, the regulatory environment changes, and cost dynamics evolve, many investors may wish to know.
The Narrative in the Numbers
Revenue, EBITDA, and Free Cash Flow (FCF)
| Quarter | Revenue ($ Mil) | EBITDA ($ Mil) | Free Cash Flow ($ Mil) |
| 2024-Q4 | 100,820 | 9,729 | 12,954 |
| 2024-Q1 | 100,807 | 8,835 | 1,457 |
| 2025-Q2 | 109,575 | 10,165 | 4,558 |
| 2025-Q3 | 111,616 | 6,302 | 6,193 |
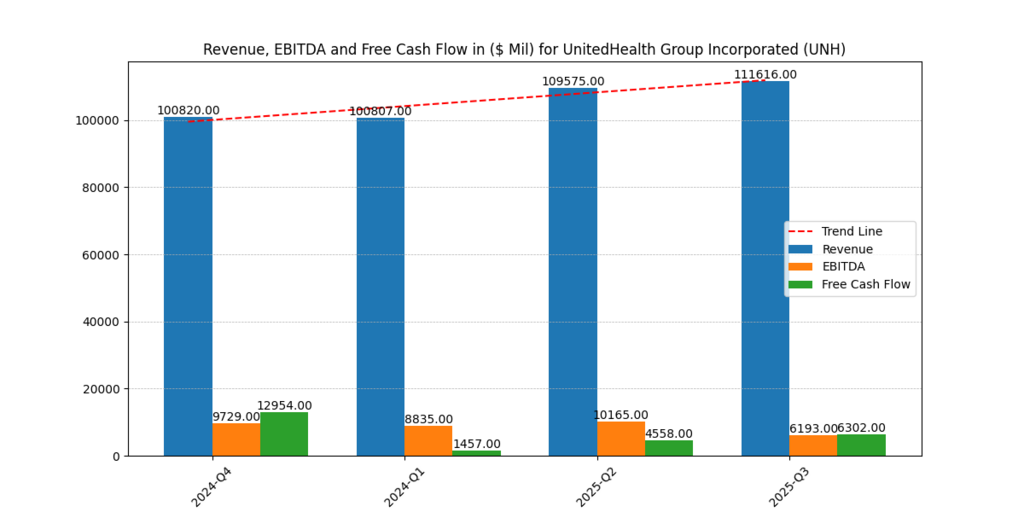
Figure 1: Trends in Revenue and Free Cash Flow of UnitedHealth Group (2024 to 2025). The revenue growth is stable and the free cash flow is erratic
Revenue also boasts a steadfast positive growth trend, and Q3 2025 is expected to reach more than $111.6 billion. Whereas FCF and EBITDA are more volatile and show more fluctuation with the cost pressures and the investment cycles. Instead, the erratic cash flow is likely to trigger uneasiness on the part of short-term traders; more specifically, the shocking decrease of cash flow during Q1 can be frightening. To long-term investors, however, it is an indication that strategic reinvesting and cyclical oscillation are still at play (Barron’s, 2025)
Cash Flow from Operations to Expenditures: A Coveted Safety Buffer
The ratio of cash flow from operations to expenditures at UNH surged to 8.11x in Q3 2025, a record high, indicating that it received more than eight times the amount of expenditure. This type of liquidity provides psychological support to investors, as it reassures them that they will not be overwhelmed by any situation. This kind of strength brings peace in the storm of uncertainty (Yahoo Finance, 2025).
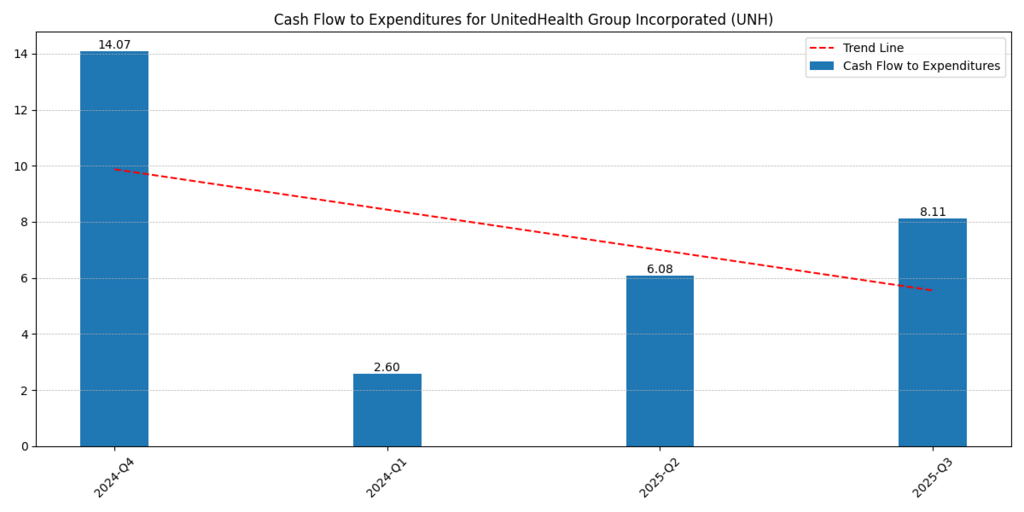
Figure 2: Cash Flow From Operations to Expenditures Ratio. In Q3 2025, UNH had 8.11 times more generation of operating cash than it spent, and this shows excellent liquidity.
Debt: Declining Load, But Watch the Margins
| Quarter | Total Debt-to-Cash Flow | Total Debt-to-EBITDA |
| 2024-Q4 | 5.59 | 8.02 |
| 2024-Q1 | 32.46 | 8.70 |
| 2025-Q2 | 14.90 | 8.00 |
| 2025-Q3 | 11.02 | 12.79 |
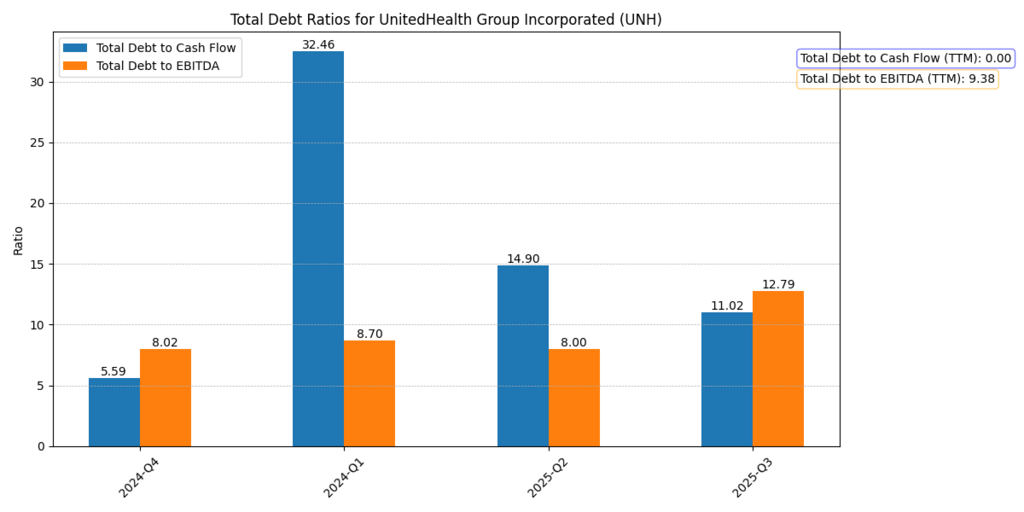
Figure 3: Total Debt to Cash Flow and Total Debt to EBITDA Ratios. Debt-to-cash-flow has improved significantly, though the recent uptick in debt-to-EBITDA signals caution on leverage risks.
The level of liquidity is one of the strongest features of UnitedHealth, where the ratio of the cash flow of operations to expenditures reached 8.11x in Q3 2025, indicating that the inflows of operations exceed expenditures many times and there is much of it left to be reinvested or used to service the debt (Yahoo Finance, 2025).
Meanwhile, the assets are still greater than the liabilities according to the Assets and Liabilities graph, which has served to support the stability of the company and how analysts are comfortable with it holding in the long term (Barron’s, 2025). The debt ratios consolidate such an image with the Total Debt-to-Cash Flow undergoing a significant improvement in the past year, even though there was a recent rise in the Total Debt-to-EBITDA ratio, indicating that the leverage risks can reemerge in the case of further weaker margins (MarketWatch, 2025).
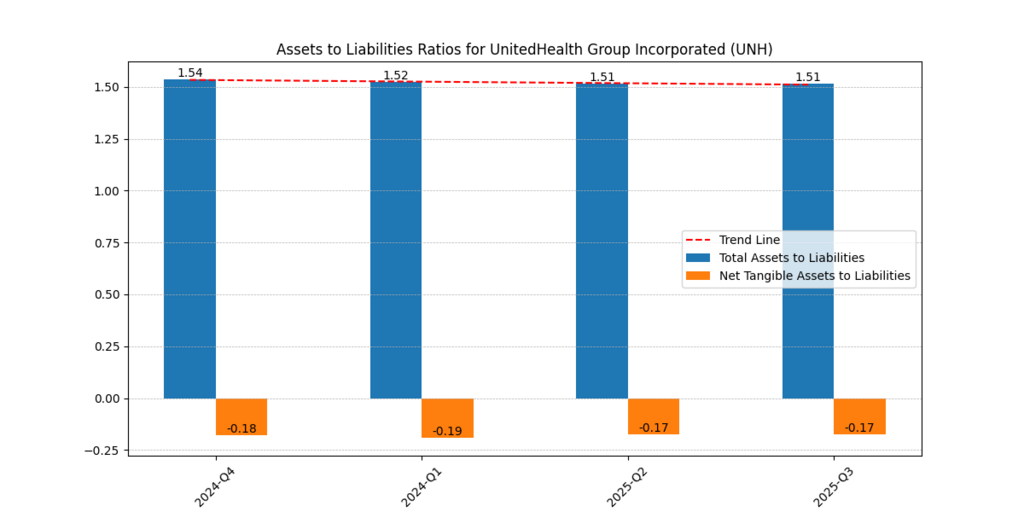
Figure 4: UnitedHealth: Assets and Liabilities. The asset levels of the company are always above liabilities, and this strengthens the balance sheet position over the longer term.
Operational Margins Under Pressure
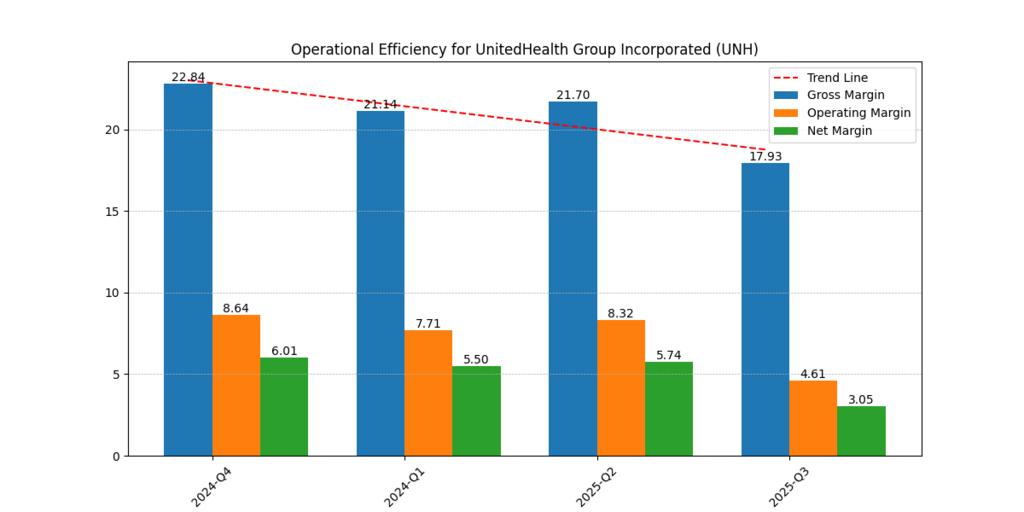
Figure 5: Gross, Operating, and Net Margin Trends (2024-2025). Margin compression indicates increased healthcare usage and the medical cost ratio.
- Gross margin decreased during the period between quarter four in 2024 and quarter three in 2025, when it dropped to 17.93 % of the value that was obtained in quarter four in 2024, which stood at 22.84 %
- Operating margin: decreased as compared to 8.64 % to 4.61 %
- Net margin: experienced a dramatic reduction to 3.05 %
Margin compression contributes to Zeal-if this can go on? There is always temptation to dwell on the deterioration when it seems so apparent constantly, but savvy planners can acknowledge that the healthcare costs and trends in reimbursement are cyclical. That is, transitory margin deterioration is not the same as structural collapse (Reuters, 2025).
Coverage Ratios Show Slight Weakening
- In Q3 2025, EBIT coverage is decreased to 4.97x
- The EBITDA coverage also backed off
These levels may still project a healthy buffer to obligations, but the trend deserves attention because it can increase the anxiety of investors in the short run (Investopedia, 2025).
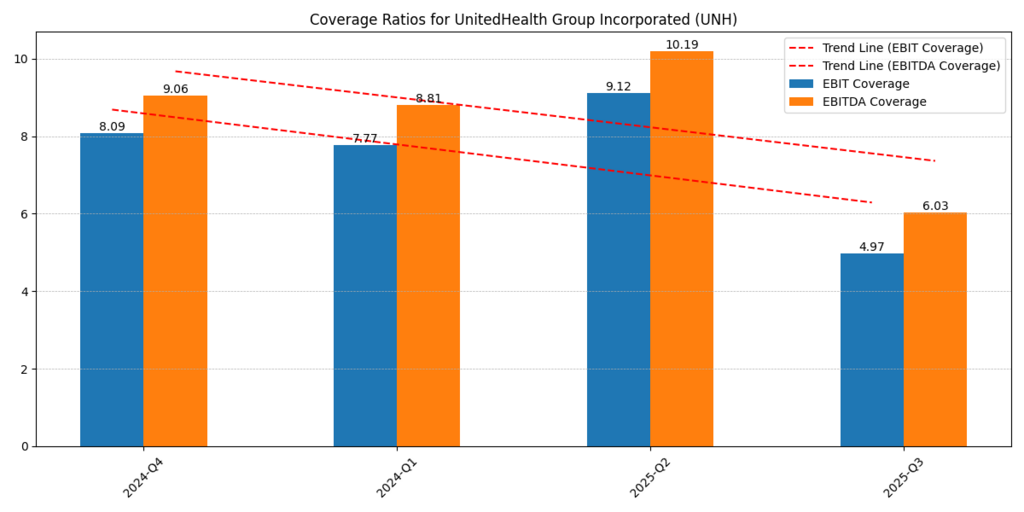
Figure 6: EBIT and EBITDA Coverage Ratios (Figure 6). The decreasing coverage levels are an indication of cost pressures, but adequate capacity to pay obligations is evident.
Returns on Equity and Capital Remain Attractive
- ROE (Q3 2025): 3.60 % (quarterly)
- ROTC: 2.78 %
- ROE (TTM): 22.60 %
- ROTC (TTM): 16.76 %
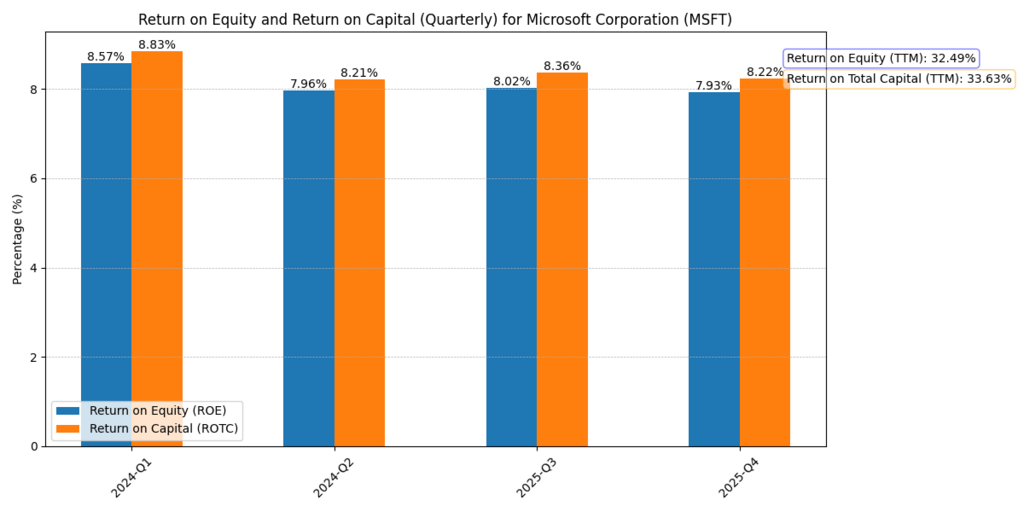
Figure 7: Return on equity (ROE) and return on total capital (ROTC). Trailing twelve-month levels continue to be very strong despite the weaker last quarters, in line with capital efficiency.
Experienced investors feel secure with high past trailing returns; they provide a psychological foundation when short-term performance falls. The UNH Stock Forecast 2025 is positive in terms of fundamentals due to the company’s capability to earn high returns on capital (StockAnalysis, 2025).
Analyst Sentiment & Forecasts
UnitedHealth has had a tumultuous year, with shares falling ~42-50 percent YTD due to cost overruns, strain on its Medicare business, withdrawal of guidance, and CEO turnover. Despite these challenges, analysts remain cautious yet hopeful. Earnings estimates in the mid-$18 to low-$20 range in 2025, Leerink Partners and Morgan Stanley see EPS as they remain Overweight/Outperform (Barrons, 2025).
Agreement prices do not describe or target prices.
- StockAnalysis.com: Avg. target ~$397.78,→ ~ 31 % upside (StockAnalysis, 2025).
- UBS, Morgan Stanley range $374–400 (Investopedia, 2025).
- HSBC: grow more conservative–downgraded to ‘Reduce’, target 270 (MarketWatch, 2025).
This contrasts with the tug-of-war in the market psychology: apprehension vs. conviction.
Further Reading : Expert Insights on the 4 Biggest AI Stocks Fundamental Analysis: Best Value Investing Principles
Summary Table: Positives vs. Risks
| Positive Anchors | Lingering Risks |
| Strong revenue growth into Q3 2025 | Margin compression across gross, operating, net levels |
| Very high cash flow-to-expenditure ratio (8.11×) | Volatile free cash flow and earnings |
| Improved debt metrics, enhanced paydown capacity | Rising debt-to-EBITDA raises caution |
| High TTM ROE (22.6%) and ROTC (16.8%) | Weak recent quarterly returns erode confidence |
| Core operations still profitable with decent coverage | Analyst guidance lowered; Medicare Advantage challenges persist |
| Analyst targets suggest 20–30 % upside | Regulatory and reputational concerns (e.g. DOJ investigation) |
Financial Beings Price Prediction
| Scenario | No Growth Price / Share ($) | Growth Price / Share ($) | 2025 Value Added Earnings ($) | 2026 Value Added Earnings ($) |
| 4% Growth | 326.73 | 415.22 | 8.11 | 11.05 |
| 5% Growth | 326.73 | 447.60 | 8.11 | 11.05 |
| No Growth | 326.73 | – | 8.11 | 11.05 |
Short-term traders could react to the erosion of margin and volatility by panicking to buy or panicking to sell. But a beaten-down giant with high cash generation and capital returns is a reality over the long term to value-focused investors. Such a behavior dichotomy preconditions the UNH Stock Forecast 2025: fear overrides in the short, conviction secures in the long (Kiplinger, 2025). This story is everything- when institutional heavyweights move, you relax and grow confident.
Conclusion:
UNH Stock Forecast 2025 does not give a straight line. It is a journey characterised by upheavals over a solid foundation. Earning pressures and market excitement bring vicissitude in the short term. Nonetheless, the long-run advantages, such as revenue growth, liquidity, capital efficiency, and dominance in the market, give promising grounds to the decision to invest on a medium- or long-term basis.
In other words, the prognosis is one of restrained optimism, but it is influenced significantly by how well it delivers and the increasing medical costs.
Disclaimer
The content provided herein is for informational purposes only and should not be construed as financial, investment, or other professional advice. It does not constitute a recommendation or an offer to buy or sell any financial instruments. The company accepts no responsibility for any loss or damage incurred as a result of reliance on the information provided. We strongly encourage consulting with a qualified financial advisor before making any investment decisions.

