This Alphabet stock analysis helps investors evaluate the company’s valuation and long-term prospects by examining quarterly data trends and using tabular and visual forms. In an increasingly AI-driven digital economy, Alphabet Inc. (NASDAQ: GOOGL) maintains its strategic leadership and financial stability. After Alphabet’s Q2 2025 earnings were announced, a thorough analysis of the company’s sales performance, operational effectiveness, balance sheet strength, and return ratios provides information about its inherent value.
Balance Sheet Strength: Assets to Liabilities Ratios
Alphabet’s financial stability is strengthened by its prudent capital structure. The Total Assets to Liabilities ratio has been consistently above 3.5 for the last four quarters, indicating that Alphabet has more than three times the assets needed to pay its liabilities. In the meantime, even when intangibles are taken out of the equation, Net Tangible Assets to Liabilities continuously surpassed 2.3, demonstrating its solid solvency.
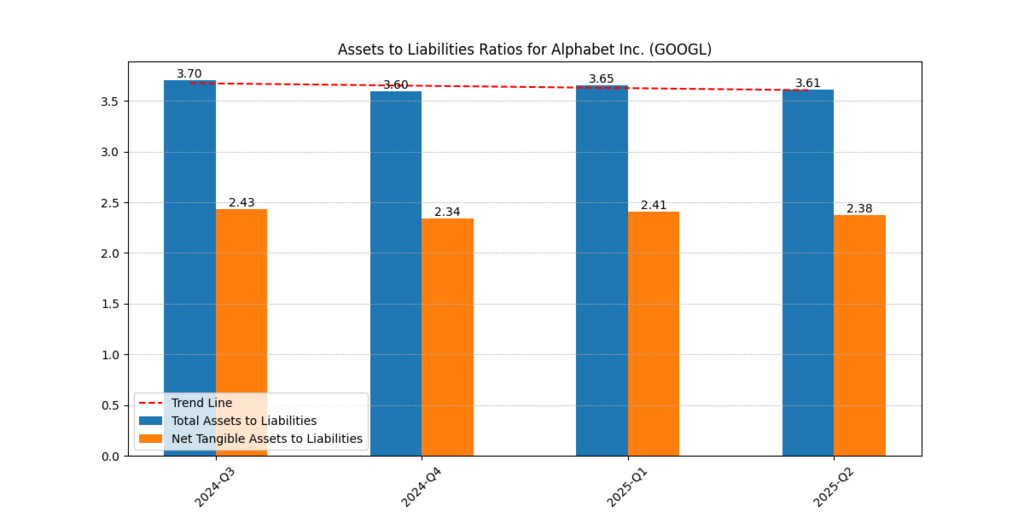
Fig 1: Alphabet’s asset position is consistently robust, with a total assets-to-liabilities ratio exceeding 3.6x in all quarters.
| Quarter | Total Assets to Liabilities | Net Tangible Assets to Liabilities |
| 2024-Q3 | 3.70 | 2.43 |
| 2024-Q4 | 3.60 | 2.34 |
| 2025-Q1 | 3.65 | 2.41 |
| 2025-Q2 | 3.61 | 2.38 |
According to these measures, Alphabet is one of the most financially stable tech companies in the world, providing a sizable buffer for R&D, investments, and economic downturns (Morningstar, 2025). Its increasing capital expenditures in AI infrastructure are also supported by this framework.
Operational Efficiency: Margin Trends Hold Strong
Throughout the quarters, Alphabet’s profitability stayed consistent. The gross margin remained close to 59%, demonstrating efficient revenue creation. While net margin increased to 38.28% in Q1 2025, probably as a result of cost efficiency and effective AI service monetization, operating margins continuously surpassed 32%.
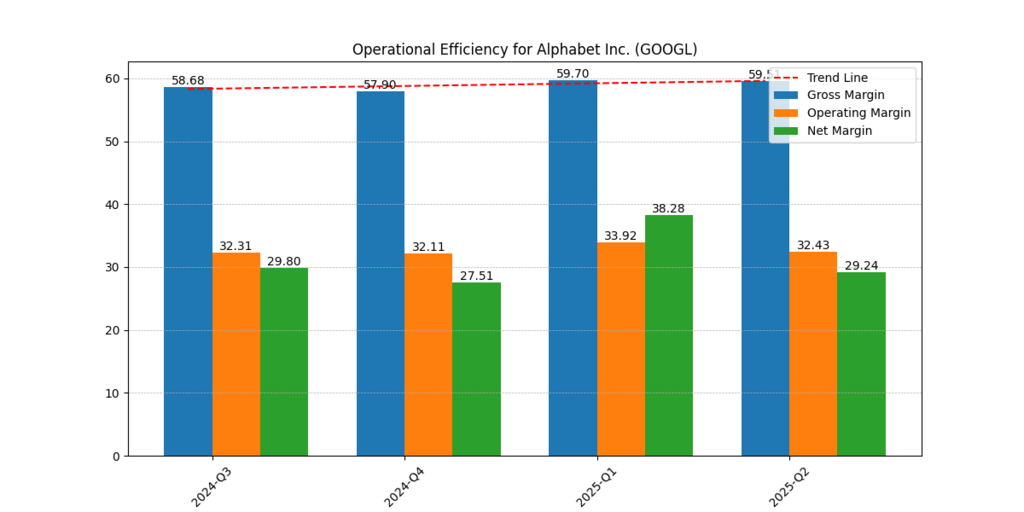
Fig:2 Net margin increased in Q1 2025 as a result of AI-related improvements; gross and operating margins stayed steady.
| Quarter | Gross Margin (%) | Operating Margin (%) | Net Margin (%) |
| 2024-Q3 | 58.68 | 32.31 | 29.80 |
| 2024-Q4 | 57.90 | 32.11 | 27.51 |
| 2025-Q1 | 59.70 | 33.92 | 38.28 |
| 2025-Q2 | 59.51 | 32.43 | 29.24 |
Increased capital expenditures and R&D spending, particularly in areas like Google Cloud and Gemini AI, are partially responsible for the modest reduction in net margin in Q2 2025. However, despite growing cost pressures in the IT industry, Alphabet is competitive due to its ability to sustain strong margins (Goldman Sachs, 2025).
Top-Line Growth vs. Free Cash Flow Volatility
Alphabet’s revenue showed strong growth, increasing to $96.4 billion in Q2 2025, the same amount as in Q4 2024. While Free Cash Flow (FCF) saw a steep drop in Q2 to $5.3 billion from $24.8 billion in Q4 2024, EBITDA remained strong as well.
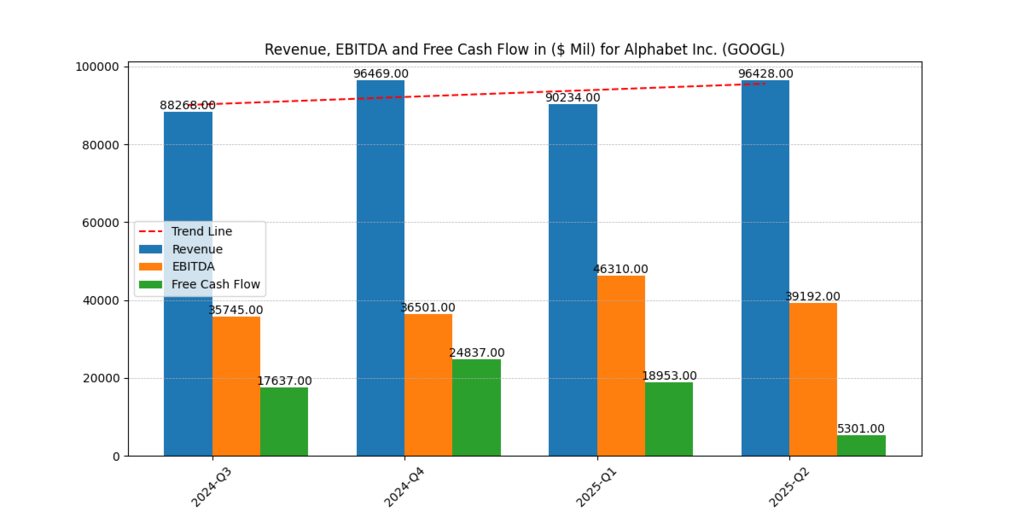
Fig 3: Revenue and EBITDA stayed high, but increased capital expenditures caused a dramatic decline in free cash flow in Q2 2025.
| Quarter | Revenue ($M) | EBITDA ($M) | Free Cash Flow ($M) |
| 2024-Q3 | 88,268 | 35,745 | 17,637 |
| 2024-Q4 | 96,469 | 36,501 | 24,837 |
| 2025-Q1 | 90,234 | 46,310 | 18,953 |
| 2025-Q2 | 96,428 | 39,192 | 5,301 |
Alphabet’s deliberate reinvestment in high-growth industries, particularly AI technology and data center expansions, is reflected in the decline in FCF. Alphabet is one of the largest infrastructure investors in the field of generative AI at the moment, according to (Reuters 2025). This improves long-term competitiveness at the expense of short-term liquidity.
Further reading : The Best Growth Stocks to Buy Now for a Profitable 2025 and Beyond
Return Ratios: High Efficiency with Capital
Alphabet stock analysis is crucial because it keeps generating high profits. Return on Capital (ROTC) peaked at 11.34% in Q1 2025, while Return on Equity (ROE) was 10.0%. Despite a modest dip in Q2 2025, both metrics are still above long-term norms.
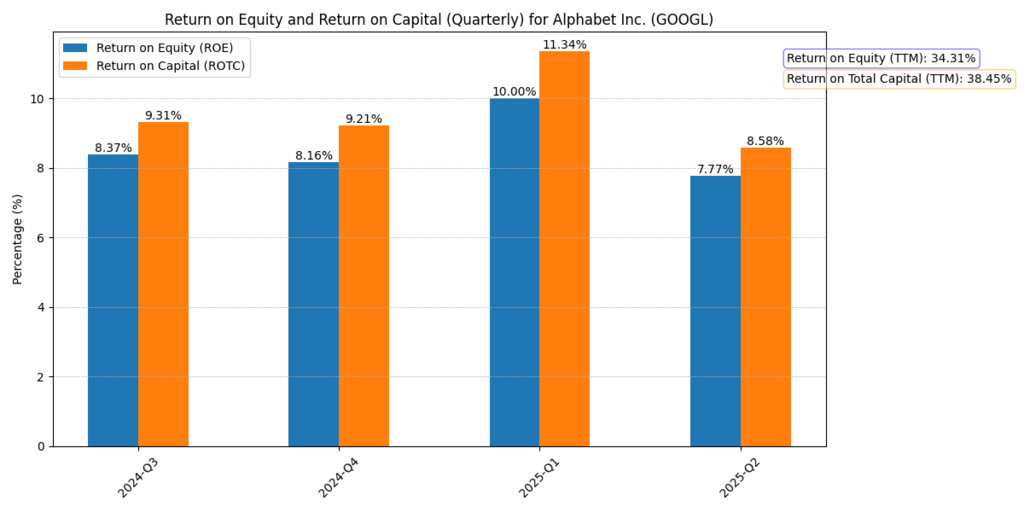
Fig 4: Strong capital efficiency is seen in Alphabet’s quarterly results, with ROE and ROTC reaching their highest points in Q1 2025.
| Quarter | Return on Equity (ROE) | Return on Capital (ROTC) |
| 2024-Q3 | 8.37% | 9.31% |
| 2024-Q4 | 8.16% | 9.21% |
| 2025-Q1 | 10.00% | 11.34% |
| 2025-Q2 | 7.77% | 8.58% |
Trailing Twelve Months (TTM):
ROE: 34.31%
ROTC: 38.45%
These impressive returns are a reflection of effective capital allocation and are consistent with Alphabet’s high asset turnover and low debt load. These are particularly pertinent during a time of intense investing and changing market competition.
Valuation and Fair Value Outlook
Assuming a 10% discount rate, modest revenue growth, and capital reinvestment, our prior estimate put Alphabet’s fair value per share is $223/share. Current measures support this estimate. The idea that Alphabet’s stock is still relatively cheap is supported by the company’s strategic AI drive, solid earnings foundation, and return ratios.
Conclusion
Following Q2 2025, this Alphabet stock analysis highlights a well-balanced growth narrative. Alphabet continues to produce solid returns, high operating margins, and a fortress-like balance sheet despite a brief drop in free cash flow. Alphabet continues to be a pillar tech company with long-term growth potential thanks to its growing AI investments, monetization of Gemini and YouTube Shorts, and strong capital efficiency.
Because of its steady profitability and reinvestment discipline, Alphabet is an appealing buy below intrinsic value for investors looking for lasting value in the AI era.
Disclaimer
The content provided herein is for informational purposes only and should not be construed as financial, investment, or other professional advice. It does not constitute a recommendation or an offer to buy or sell any financial instruments. The company accepts no responsibility for any loss or damage incurred as a result of reliance on the information provided. We strongly encourage consulting with a qualified financial advisor before making any investment decisions.

