XOM vs CVX stock in 2026- compare dividend yield, valuation upside, and risk inference to find out whether Exxon Mobil or Chevron is the superior long-term investment choice for the income-based and risk-averse group of investors.
Energy stocks remain a significant option for investors seeking dividend income and inflation hedge in 2026. Exxon Mobil (XOM) and Chevron (CVX) are typically the leading companies for comparison as they are both global, long-standing, integrated oil and gas companies with dividend histories.
But it is not all about the size of the company in terms of xom vs cvx stock. In fact, the choice has been narrowed down to three practical questions:
- Which stock has better dividends (yield + growth)?
- Which stock appears more expensive on growth assumptions?
- Which company will be less risky, assuming change in oil prices or margins compression?
Why Investors Compare XOM vs CVX Stock in 2026
XOM and CVX are operating in the same industry, yet they may act differently since their business mix is not the same. Both earn revenue through the upstream production and downstream operation (refining/marketing), and both of them provide money to the shareholders primarily in the form of dividends.
To a long-term investor in 2026, the attraction is obvious:
- Cash flow potential in the case of high energy prices.
- Dividends are one of the core returns.
- Massive and international diversification over smaller producers.
Nonetheless, the risks are also obvious:
- Profitability may change drastically over cycles.
- Capital outlay may be difficult to schedule.
- Market pricing may be too optimistic leaving no margin of safety.
This is why the comparison of dividends, valuation assumptions, and risk exposure becomes imminent.
Exxon Mobil vs Chevron Stock – Business Model and Scale Comparison
An excellent method to figure out xom vs cvx stock is to check what the companies are selling primarily (their revenue mix). Even though they are both incorporated, their exposure to the segment may alter the way stable earnings are experienced in various market conditions.
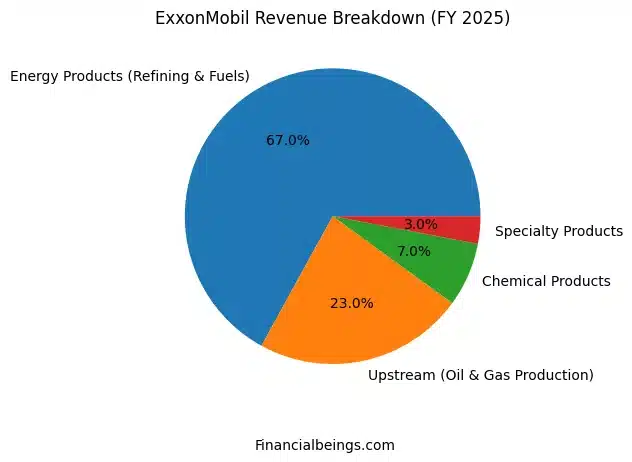
The FY 2025 revenue configuration of ExxonMobil is:
- 67% energy Products (Refining and Fuels)
- 23% Upstream (Oil & Gas Production)
- 7% Chemical Products
- 3% Specialty Products
This indicates that XOM is more downstream-oriented. It is important since downstream profitability has a tendency to be highly dependent on margins, product demand, and crack spreads and not just crude prices.
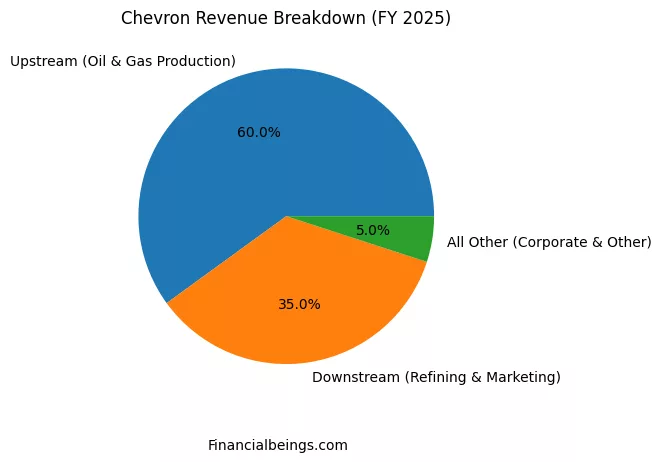
Chevron’s FY 2025 revenue mix is:
- 60% Upstream (Oil & Gas Production)
- 35% Downstream (Refining and Marketing)
- 5% All Other
This demonstrates that CVX is upstream-oriented. That usually implies that Chevron will have a closer relationship between its cash flow and the trends in crude prices and the performance of its upstream activities.
- CVX has increased upstream exposure.
- Under certain conditions in an energy market, it is possible to appear better than the other even when the entire industry is heading in a similar direction.
XOM vs CVX Stock Dividend Comparison in 2026
Dividend investors are concerned mainly with the current yield and how dividend growth would be over time. An increased yield offers superior and immediate income, whereas a stable and long-term growth is an indication of financial stability and reliability of cash flow. In comparing the XOM vs CVX share, the two companies are attractive with regard to yield, and with time, long-term reliability and growth patterns would ultimately decide which dividend profile is better.
Dividend Yield and Payout Stability
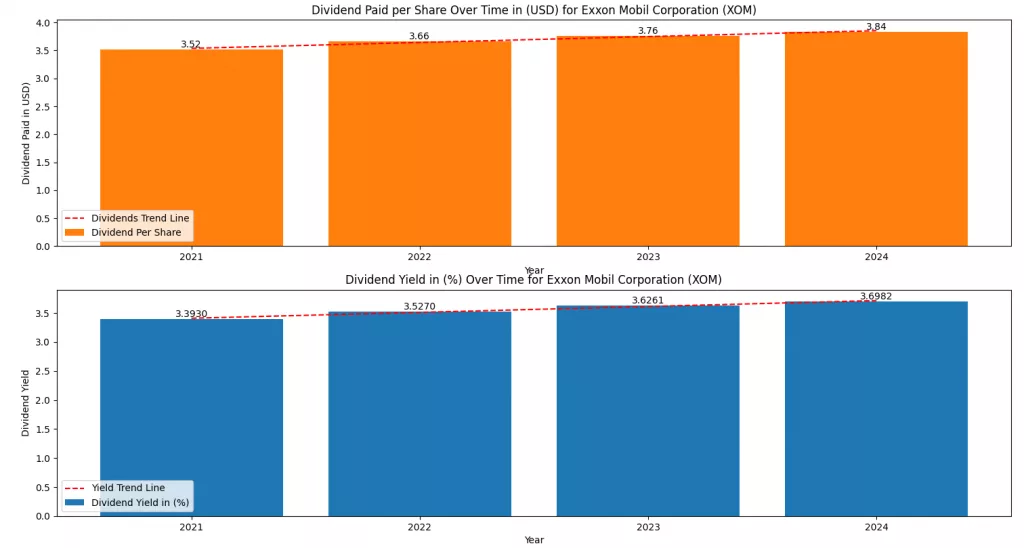
Dividend per share is:
- 2021: 3.52
- 2022: 3.66
- 2023: 3.76
- 2024: 3.84
And XOM dividend yield increases from about 3.3930% (2021) to 3.6982% (2024).
This suggests:
- Growth in dividends is not explosive.
- yield is good, although not the best in this comparison.
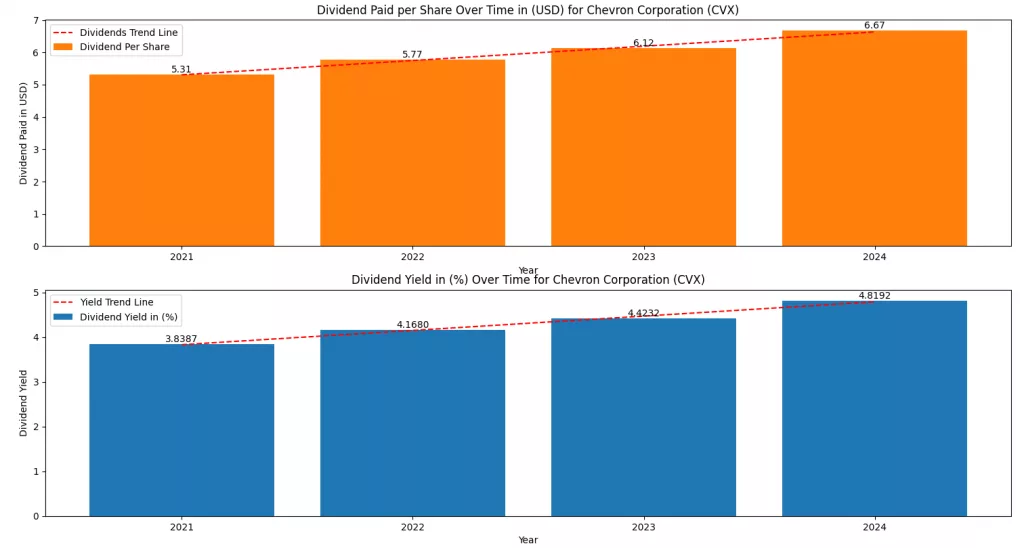
From CVX dividend, dividend per share is:
- 2021: 5.31
- 2022: 5.77
- 2023: 6.12
- 2024: 6.67
And CVX dividend yield rises from about 3.8387% (2021) to 4.8192% (2024).
This shows:
- CVX is paying a higher dividend per share.
- Dividend yield is significantly higher than XOM by 2024.
Dividend Comparison Table
| Metric | 2021 | 2022 | 2023 | 2024 |
| XOM dividend per share | 3.52 | 3.66 | 3.76 | 3.84 |
| CVX dividend per share | 5.31 | 5.77 | 6.12 | 6.67 |
| XOM dividend yield (%) | 3.3930 | 3.5270 | 3.6261 | 3.6982 |
| CVX dividend yield (%) | 3.8387 | 4.1680 | 4.4232 | 4.8192 |
The dividend profile of CVX is better in 2026 as it has both higher yield and greater growth during 2021-2024.
Dividend Growth vs Oil Price Cyclicality
High dividend does not merely mean high current yield. It is also about the sustainability of cash flows that pass the test of time.
It suggests:
- CVX has a greater yield; however, given its heavy upstream derivation, dividend cover is more susceptible to crude prices.
- The downstream exposure of XOM may be a helpful addition during periods of tightening upstream margins.
In other words:
CVX = higher income, which could be greater oil price sensitive.
XOM = also slightly less income, possibly more balance in operations.
This is among the reasons why investors maintain both in watchlists and are selected according to their risk tolerance.
Which Is the Better Dividend Stock: XOM or CVX?
When you want the highest dividend yield and noticeable dividend growth, it is obvious that you prefer Chevron (CVX).
Assuming that you are more interested in dividend earnings that are more diversified across business lines, some investors will still lean towards the operational mix as presented by XOM, though the yield may be lower.
But purely in terms of the dividends results indicated: CVX wins.
XOM vs CVX Stock Valuation – What’s Already Priced In?
The most crucial aspect of 2026 is this, as investors might lose money regardless of high dividends in case the stock has been overpriced.
XOM vs CVX Valuation Sensitivity (Interactive Chart)
Valuation sensitivity that shows the intrinsic price adjustments under 0%-6% growth rate scenarios in the long run.
According to this,
- The intrinsic value of XOM increases at about approximately ~$104 at 2% to ~$157 at 6%.
- Intrinsic value of CVX increases approximately ~$88 at 2% to ~$131 at 6%.
- There is a band of GDP shading (2%-3%) of what normal macro growth may appear to be, suggesting that the assumptions of high growth are more difficult to hold on to in mature oil majors.
Why does this matter?
This risk is experienced by investors when the valuation of a stock is highly sensitive to growth:
- There may be a rapid decrease in the fair value, when the market re-evaluates the stocks based on the news and future developments.
For XOM vs CVX Stock Valuation – What’s Already Priced In?
- XOM’s implied growth is about 7%
- CVX’s implied growth is about 6.8%
- Both stocks are costly at the present price.
This is the crucial valuation caution in 2026: even superior companies are susceptible to being risky when the market is already assuming excessively high long-term growth.
Risk Profile Comparison – Is XOM or CVX the Safer Energy Stock?
To compare risk, we need to draw attention to three areas:
- Profitability Volatility (RNOA).
- NOA operating structure (balance sheet vs operating liabilities)
- Business mix exposure (segments).
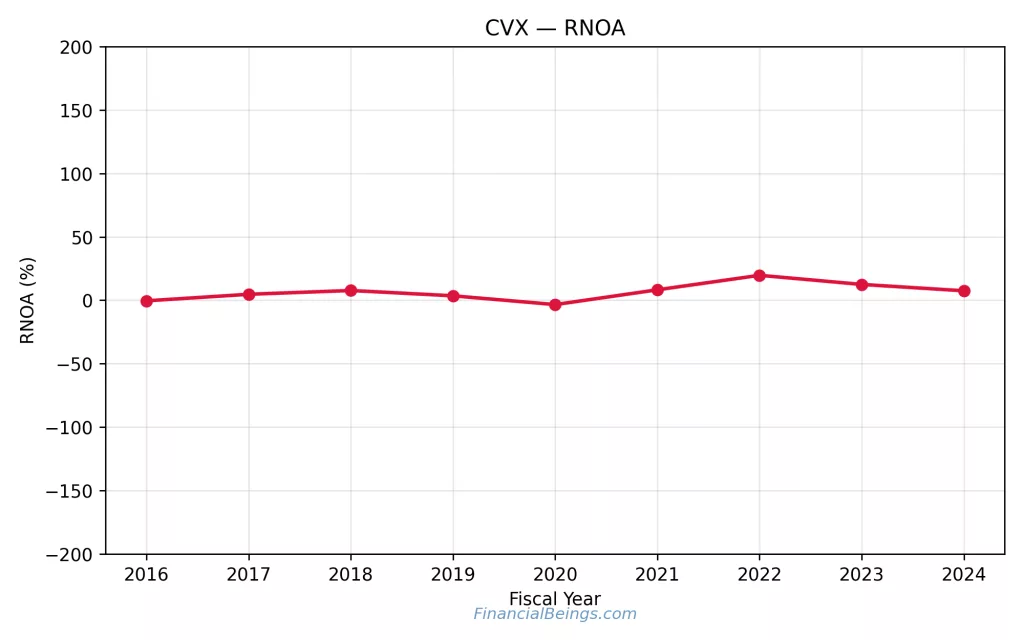
Oil Price Sensitivity and Earnings Volatility (RNOA)
From the CVX RNOA results:
- It was on top near ~20% in 2022
- It drops below zero in 2020
- It becomes stable again in 2023–2024
From the XOM RNOA:
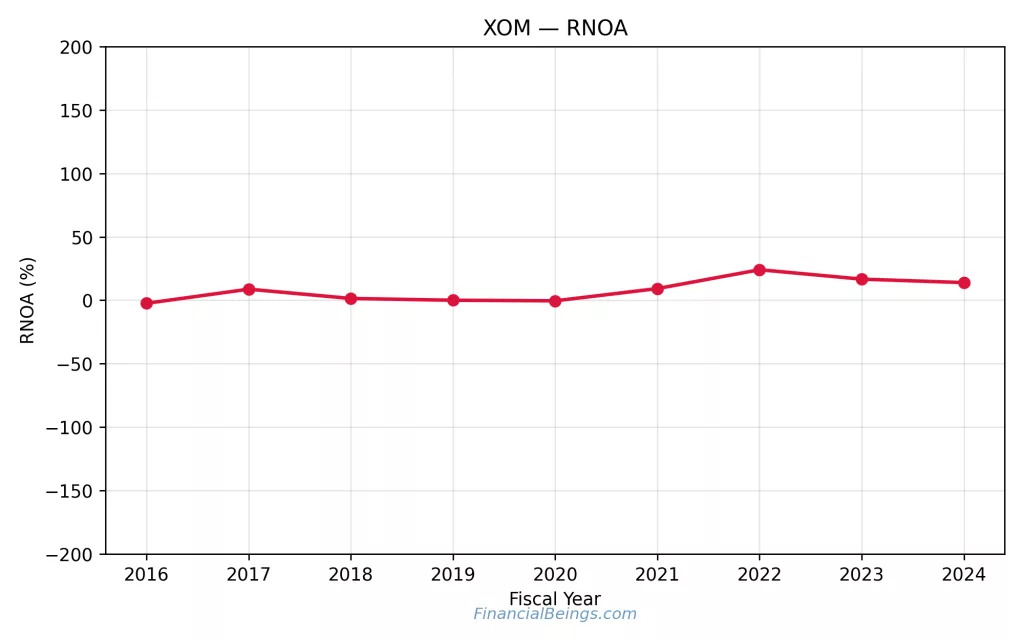
- It peaks near ~24% in 2022
- It is near zero around 2019–2020
- It is stabilized and cyclical.
RNOA takeaway:
- XOM is more upside biased in its peak profitability.
- CVX seems to be a little smoother over the period (greater stability).
Capital Allocation and Capex Risk (NOA vs Operating Liabilities)
The operating liabilities and the Net Operating Assets (NOA) are used to demonstrate the way in which the operating structure varies over the time.
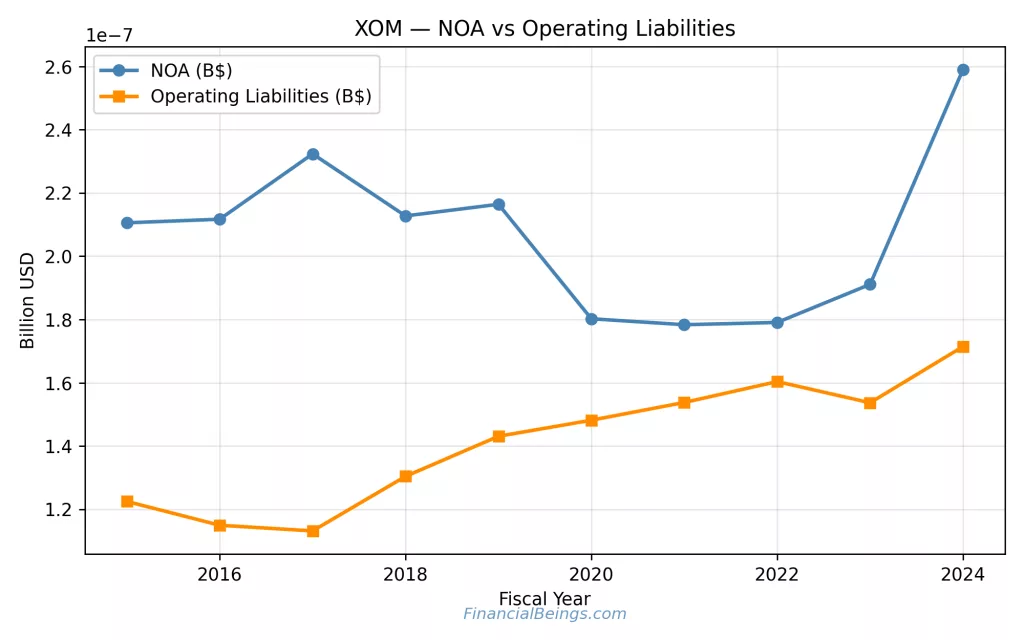
From the XOM:
- NOA falls back around 2020-2022 and increases to 2024.
- Operating liabilities surged, with a significant increase towards the year 2024.
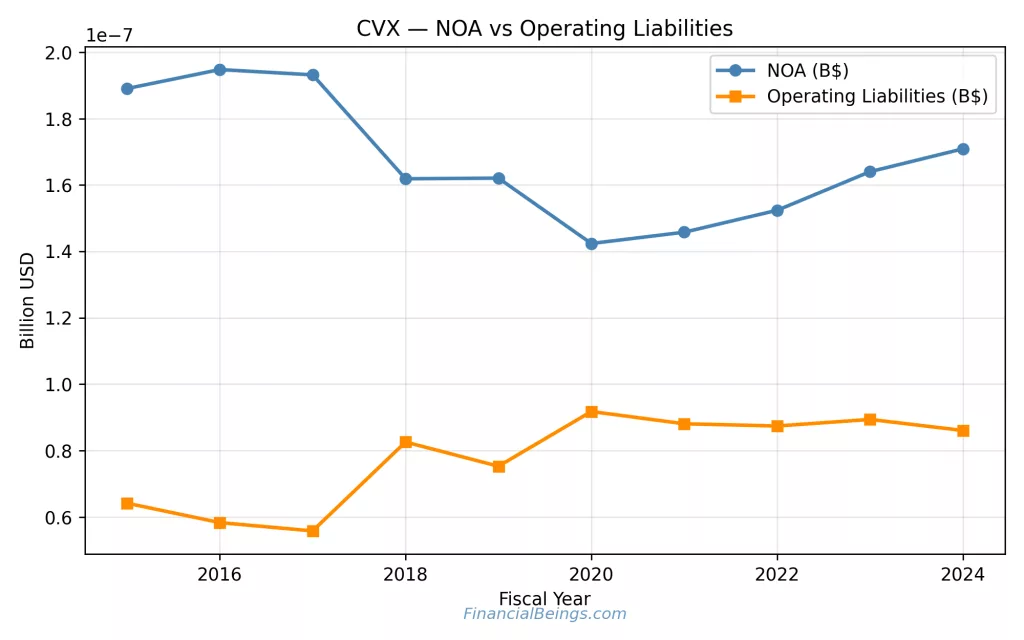
- NOA is less volatile than the trend of XOM.
- The operating liabilities increase sharply until 2020, and then it becomes flatter.
NOA takeaway:
CVX appears more reliable in operating asset base than XOM (which may indeed represent more upside to the portfolio, but also exposes it to cyclicality nature of energy sector).
Energy Transition and Long-Term Risk Exposure
The 2026 transition risk of both companies still exists:
- pressure on regulation and decarbonization.
- growth demand in oil, which is uncertain in the long-term.
- risk of excessive capex investment that may occur during high price pressure times amid geopolitical uncertainty.
Both companies have revenue that is very much related to traditional energy businesses, and that the revenue is highly dependent on the long-term transition risk.
In addition, disclosures and filings of the companies are also a major source of insight into the immediate strategic updates and risk elements.
Which Is the Better Stock in 2026: XOM or CVX?
CVX is stronger on dividend and conservative income appeal (greater yield, greater dividend growth) wins. XOM scores higher on the profitability upside potential (greater RNOA peak), but with greater cyclicality. Both are costly, assuming the market demands implied growth of ~7% and ~6.8% in a mature industry.
That is why it depends on the investor profile.
XOM vs CVX Stock – Final Verdict by Investor Profile
| Investor Type | Better Choice |
| Income | CVX |
| Conservative | CVX |
| Cyclical Upside | XOM |
| Value-Focused | Neither (wait for better entry) |
In 2026, the xom vs cvx stock debate will not be so much about quality but positioning.
Chevron is now better in terms of dividend strength and slightly reduced structural volatility. In good cycles, Exxon has higher operating leverage.
Both, however, seem to be priced on long-term high growth, and valuation sensitivity indicates a low margin of safety.
All calculations and valuation estimates are FinancialBeings’ own, based on data sourced from SEC filings of XOM (10K and 10Q) and CVX (10K and 10Q), use or reproduction before prior approval is prohibited.
FAQs on XOM vs CVX Stock
Is XOM or CVX a better dividend stock in 2026?
Chevron (CVX) is a better dividend stock in 2026. CVX has a higher dividend yield (estimated at 3.83% in 2026) and better growth in dividends between 2021 and 2024 than XOM (estimated at 2.72% yield in 2026). Whereas Exxon can be considered a consistently growing company, Chevron can be considered as having a significantly higher income per share and greater growth momentum. CVX is at an advantage at the present to the income-oriented investor who is interested in cash payout.
Which stock is safer, Exxon Mobil or Chevron?
Chevron can be considered a little less risky according to the indicators of stability. CVX has fewer erratic trends in NOAs, and a less smooth recovery in RNOA than the more volatility Exxon is more volatile. Exxon is more cyclical, although it is more peak-returning. CVX has a small structural advantage, especially to the conservative investor who is looking to have a lower volatility exposure in the energy market.
Is XOM more undervalued than CVX?
According to the analysis of valuation sensitivity, neither of the stocks are not distinctly undervalued. The implied long-term growth required by XOM and CVX is approximately equal to ~7 and 6.8, respectively, which means that both stocks are valued at high long-term growth. Oil majors tend to be closer to GDP-level growth bands, and therefore, these assumptions are ambitious. Hence, neither stock has a readily apparent margin of safety at present.
Can CVX outperform XOM in a lower oil price environment?
With a prolonged low oil price, CVX can take advantage of its disciplined operation trend and comparatively more stable asset base trends. Nevertheless, due to the increased upstream-heavy revenue mix of Chevron, there is a risk that any sustained decline in crude will subject the company to greater earnings pressure. The higher downstream coverage of Exxon would offer some protection in case the refining margins are favourable. Finally, it would be a matter of whether upstream softness is compensated by refining strength.
Usama Ali
Usama Ali is the founder of Financial Beings and a self-taught investor who blends classic valuation study with insights from psychology. Inspired by works from Benjamin Graham, Aswath Damodaran, Stephen Penman, Daniel Kahneman, and Morgan Housel, he shares independent, data-driven research to help readers connect money, mind, and happiness.
Disclaimer
The content provided herein is for informational purposes only and should not be construed as financial, investment, or other professional advice. It does not constitute a recommendation or an offer to buy or sell any financial instruments. The company accepts no responsibility for any loss or damage incurred as a result of reliance on the information provided. We strongly encourage consulting with a qualified financial advisor before making any investment decisions.